Unlock a world of possibilities! Login now and discover the exclusive benefits awaiting you.
- Qlik Community
- :
- All Forums
- :
- QlikView App Dev
- :
- Re: Qlikview Containers
- Subscribe to RSS Feed
- Mark Topic as New
- Mark Topic as Read
- Float this Topic for Current User
- Bookmark
- Subscribe
- Mute
- Printer Friendly Page
- Mark as New
- Bookmark
- Subscribe
- Mute
- Subscribe to RSS Feed
- Permalink
- Report Inappropriate Content
Qlikview Containers
Hello everyone,
Does QlikView load all charts inside container or only the one which is selected on sheet load?
- « Previous Replies
-
- 1
- 2
- Next Replies »
Accepted Solutions
- Mark as New
- Bookmark
- Subscribe
- Mute
- Subscribe to RSS Feed
- Permalink
- Report Inappropriate Content
All charts in the container will be calculated, not just the visible chart.
This can be a performance disadvantage (or advantage) over minimized or hidden charts, which are not calculated.
-Rob
- Mark as New
- Bookmark
- Subscribe
- Mute
- Subscribe to RSS Feed
- Permalink
- Report Inappropriate Content
Hi
While reloading the data only all the objects data will be loaded..only thing is whenever we open will see the data.
- Mark as New
- Bookmark
- Subscribe
- Mute
- Subscribe to RSS Feed
- Permalink
- Report Inappropriate Content
You mean when we go on sheet where there is a container with 3 charts, qlikview loads all 3 charts and display the one we are on.
Am I understanding your response correctly?
- Mark as New
- Bookmark
- Subscribe
- Mute
- Subscribe to RSS Feed
- Permalink
- Report Inappropriate Content
At the time of dashboard reloading only data will be calculated & loaded in all the charts.
Not like when ever we open the object it will reload/calculate and show the data
- Mark as New
- Bookmark
- Subscribe
- Mute
- Subscribe to RSS Feed
- Permalink
- Report Inappropriate Content
yea yu r right
it loads all the the three chats and it will display one
- Mark as New
- Bookmark
- Subscribe
- Mute
- Subscribe to RSS Feed
- Permalink
- Report Inappropriate Content
All charts in the container will be calculated, not just the visible chart.
This can be a performance disadvantage (or advantage) over minimized or hidden charts, which are not calculated.
-Rob
- Mark as New
- Bookmark
- Subscribe
- Mute
- Subscribe to RSS Feed
- Permalink
- Report Inappropriate Content
I use containers quite frequently. In one of my containers, I have a chart that can take 30 seconds or longer to render. So, to avoid bogging down the normal container load when the sheet is selected, I require the user to trigger a variable with a button object on the sheet to only render that resource intensive chart when it is requested. I use a calculation error message to tell the user they must select a date range button to render the chart.

Let me know if you would like to learn more about this.
- Mark as New
- Bookmark
- Subscribe
- Mute
- Subscribe to RSS Feed
- Permalink
- Report Inappropriate Content
Thank you mike for the alternative. Yes I would definitely like to know more about it.
Specifically, how you write calculated condition for keeping chart inactive until user have selected the option.
- Mark as New
- Bookmark
- Subscribe
- Mute
- Subscribe to RSS Feed
- Permalink
- Report Inappropriate Content
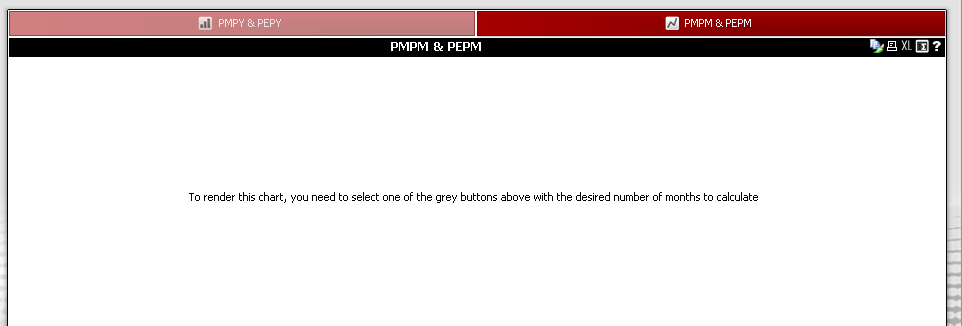
Okay, step one, you open up your chart properties and on the general tab, you add this calculation condition. Just replace your field to filter with what I have in brown here. The chart will not render unless you have at least 1 value selected. Instead of using a button, you could just use a list box with values.
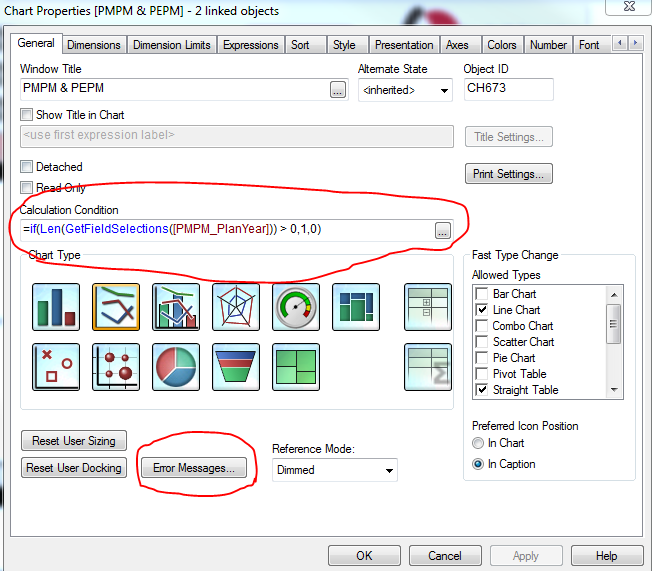
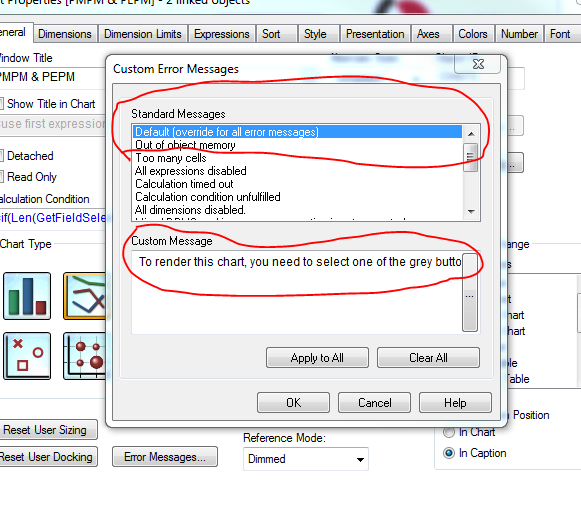
To get an error message, I just used the Default and then typed what I wanted to appear in the custom message windows. I have not played with the other choices, but there is probably one that is more specific to a failed calculation. The default met my criteria
So, the bottom line is the chart does not render until you have selected at least 1 value from any of your selected fields. I used a variable for mine. I would pick one of the dimensions you are using in your chart and use that as the criteria.
Hope that helps!
- Mark as New
- Bookmark
- Subscribe
- Mute
- Subscribe to RSS Feed
- Permalink
- Report Inappropriate Content
PS. It would be nice if Qlik gave you the ability to use triggers as you moved through tabs on a container. Or if a tab on a container had a reference name that indicated when it was the active one. Than a trigger could be assigned and the charts would only render when selected.
- « Previous Replies
-
- 1
- 2
- Next Replies »