Unlock a world of possibilities! Login now and discover the exclusive benefits awaiting you.
- Qlik Community
- :
- Forums
- :
- Analytics
- :
- New to Qlik Analytics
- :
- A set analysis question
- Subscribe to RSS Feed
- Mark Topic as New
- Mark Topic as Read
- Float this Topic for Current User
- Bookmark
- Subscribe
- Mute
- Printer Friendly Page
- Mark as New
- Bookmark
- Subscribe
- Mute
- Subscribe to RSS Feed
- Permalink
- Report Inappropriate Content
A set analysis question
Hello everybody,
I have a question and I'm hoping someone has the answer to it 😃 I have a bar chart where I'm trying to use a set analysis to show this months sale compared to last years month. This is what it looks like so far:
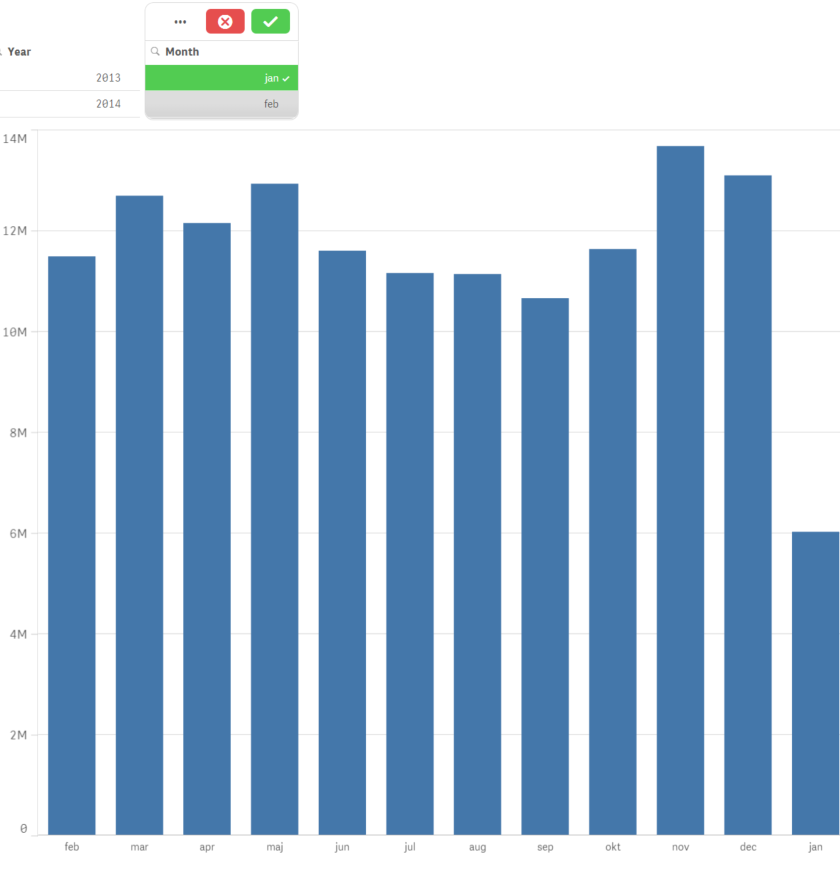
I used month as dimension and wrote an expression based on sales. The expression looks like this: Sum({<Year=, Month=, YearMonth={'>$(=Max(YearMonth-100))'}>}Sales). Everytime I choose a month, it'll be placed behind December and this was exactly what I wanted and one can see that the sum sale for that month changes as well.
However, all the other bars change as well and I don't want them to. I want them to stay the same, except for the month I choose. I tried writing an expression by using the "only" function to single the chosen month out, but can't seem to make it work.
Does anyone know how to do this?
Sincerely,
Betty
- Mark as New
- Bookmark
- Subscribe
- Mute
- Subscribe to RSS Feed
- Permalink
- Report Inappropriate Content
What is the dimension you are using in the bar chart? Is it something like YearMonth, formatted as Month only?
I wouldn't expect all the bars to change, but if you select e.g. February, your set expression will compare February and January of 2015 with March to December 2014.
While selecting Jan, the February bar should show Feb 2014 value.
So basically the set expression tells QV to list the sales values of the YearMonth one year back in time of the max yearmonth selected.
Is this what you intend to show?