Unlock a world of possibilities! Login now and discover the exclusive benefits awaiting you.
- Qlik Community
- :
- All Forums
- :
- QlikView App Dev
- :
- Re: Straight Table Filter
- Subscribe to RSS Feed
- Mark Topic as New
- Mark Topic as Read
- Float this Topic for Current User
- Bookmark
- Subscribe
- Mute
- Printer Friendly Page
- Mark as New
- Bookmark
- Subscribe
- Mute
- Subscribe to RSS Feed
- Permalink
- Report Inappropriate Content
Straight Table Filter
Hi,
Have one requirement, can please help me.
One dashboard sheet with
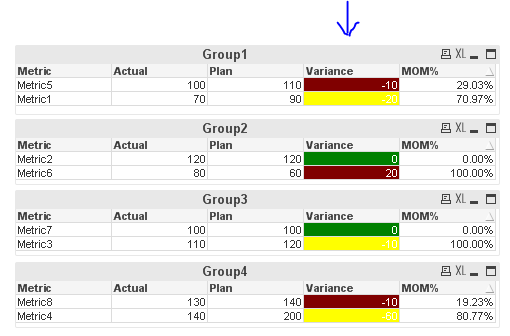
1. four straight tables with the dimensions Group1, Group2, Group3 & Group4
2. All the metrics actual value was displayed in the top of the sheet.
3. Each metric have it own RAG indicator condition defined in each table column variance.
Now the requirement is that:
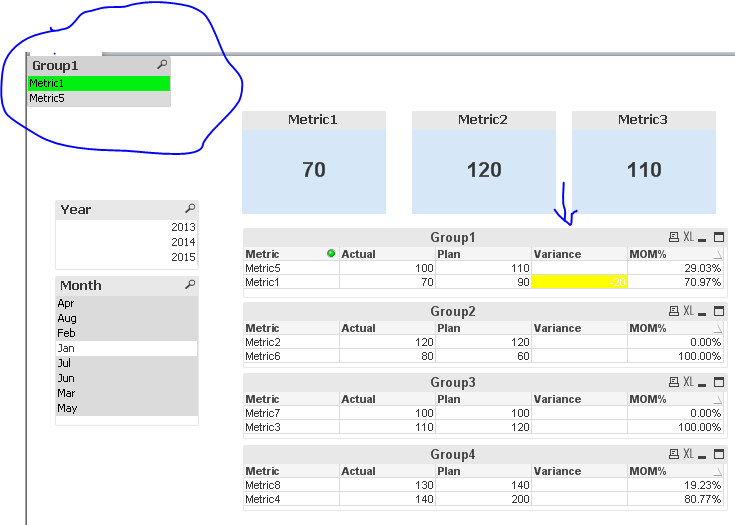
1. In each straight table have metrics based on the group, now when we select one metric it should display on the trend table.
when ever we select the metric, the rag color on the variance filed was missing since for each metric the RAG color condition was applied separately in the straight table.
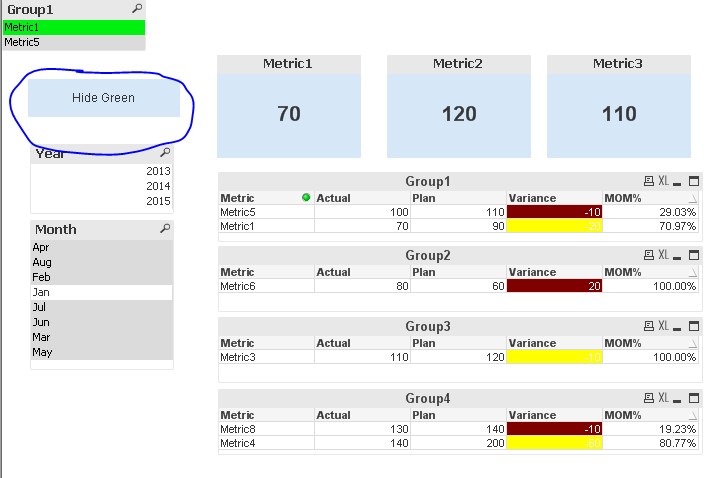
2. in the straight table say for eg. showing all the 3 colours(Red,Yellow & Green) in the variance field, we need have a filter that except Green color rows all other rows should display.
We can use detach/alternative states but the issue is that we have one global filters like year and month which should pass across all the objects.
Please find the attached sample QVW.
- Mark as New
- Bookmark
- Subscribe
- Mute
- Subscribe to RSS Feed
- Permalink
- Report Inappropriate Content
I am having a hard time understanding your requirements. Would you be able to may be re-explain them?
- Mark as New
- Bookmark
- Subscribe
- Mute
- Subscribe to RSS Feed
- Permalink
- Report Inappropriate Content
Hi,
Once see to the attachment.
1. In the variance field, we have back ground colour for different metrics
now when ever we select the metric we can see the trend in the another line chart.
2. in the variance field we have 3 different colours.(Red, Yellow, Green).
But we should have a filter to hide the the back ground color.
Can please let me know an options for my requirement.
- Mark as New
- Bookmark
- Subscribe
- Mute
- Subscribe to RSS Feed
- Permalink
- Report Inappropriate Content
Sasi V Kandragula wrote:
But we should have a filter to hide the the back ground color.
Hide background color? What do you actually mean? Sorry, but I am not sure what you are looking to do. And also where exactly do we need to hide the background color? Here?
Doesn't it already goes away as soon as you select a Metric?
- Mark as New
- Bookmark
- Subscribe
- Mute
- Subscribe to RSS Feed
- Permalink
- Report Inappropriate Content
Hi Sunny,
Yes, when ever we select any metric the variance column backgound colour will be shown only to the selected metric.
but, the requirement is that what ever may be the metric selected, the variance column background colour shuld not go. It should show the actual background colour based on the condition provided.
And apart from that, should have a filter which should have one action like when ever we click on that all the green colour rows in the straight table should hide.
- Mark as New
- Bookmark
- Subscribe
- Mute
- Subscribe to RSS Feed
- Permalink
- Report Inappropriate Content
See if the attached is what you wanted?
- Mark as New
- Bookmark
- Subscribe
- Mute
- Subscribe to RSS Feed
- Permalink
- Report Inappropriate Content
Hi Sunny,
Thank you so much. this is what I am looking for.
Once will implement in my dashboard and will get back to you.
- Mark as New
- Bookmark
- Subscribe
- Mute
- Subscribe to RSS Feed
- Permalink
- Report Inappropriate Content
Hi Sunny,
Implemented the same in my dashboard.
But issue is that :
1. Out of 4 tables, I was able to select only metrics from one single table. if I want to metric from another table I need to deselect the metric from table 1 and then I need to select.
**in your example its working fine, byt in my scenario its not working.
2. the hide green concept was not working.
In the example, directly given column(1)-column(2)<=0, because it was no where mentioned in the variance back ground condition.
- Mark as New
- Bookmark
- Subscribe
- Mute
- Subscribe to RSS Feed
- Permalink
- Report Inappropriate Content
The sample was provided by you only. Did the sample closely mimicked the actual data? I don't really know how the data is structured to be able to be able to suggest you anything. Not sure if there are confidentiality issues or if it is huge, but if neither of two is the case, would you be able to share your app?
- Mark as New
- Bookmark
- Subscribe
- Mute
- Subscribe to RSS Feed
- Permalink
- Report Inappropriate Content
Under variance back ground color condition,
There are various conditions some thing similar to below:
if(Only({<Group1=,Group2=,Group3=,Group4=>}Group1)='Metric1',
if(column(1)<=Column(3),$(vGreen),
if(column(1)>Column(3) and column(4)<0.05,$(vAmber),
if(column(1)>Column(3) and column(4)>0.05,$(vRed)))),
if(Only({<Group1=,Group2=,Group3=,Group4=>}Group1)='Metric2',
if(column(1)<=Column(3),$(vGreen),
if(column(1)>Column(3) and column(4)<0.05,$(vAmber),
if(column(1)>Column(3) and column(4)>0.05,$(vRed)))),
if(Only({<Group1=,Group2=,Group3=,Group4=>}Group1)='Metric3',
if(column(1)<=Column(3),$(vGreen),
if(column(1)>Column(3) and column(4)<0.05,$(vAmber),
if(column(1)>Column(3) and column(4)>0.05,$(vRed)))),
if(Only({<Group1=,Group2=,Group3=,Group4=>}Group1)='Metric4',
if(column(1)<=Column(3),$(vGreen),
if(column(1)>Column(3) and column(4)<0.05,$(vAmber),
if(column(1)>Column(3) and column(4)>0.05,$(vRed)))),
if(Only({<Group1=,Group2=,Group3=,Group4=>}Group1)='Metric5',
if(column(1)<=Column(3),$(vGreen),
if(column(1)>Column(3) and column(4)<0.05,$(vAmber),
if(column(1)>Column(3) and column(4)>0.05,$(vRed)))),
if(Only({<Group1=,Group2=,Group3=,Group4=>}Group1)='Metric6',
if(column(1)<=Column(3),$(vGreen),
if(column(1)>Column(3) and column(4)<0.05,$(vAmber),
if(column(1)>Column(3) and column(4)>0.05,$(vRed)))),
if(Only({<Group1=,Group2=,Group3=,Group4=>}Group1)='Metric7',$(vGrey),
if(Only({<Group1=,Group2=,Group3=,Group4=>}Group1)='Metric8',$(vGrey),
if(Only({<Group1=,Group2=,Group3=,Group4=>}Group1)='Metric9',$(vGrey),
if(Only({<Group1=,Group2=,Group3=,Group4=>}Group1)='Metric10',$(vGrey),
if(Only({<Group1=,Group2=,Group3=,Group4=>}Group1)='Metric11',$(vGrey),
if(Only({<Group1=,Group2=,Group3=,Group4=>}Group1)='Metric12',$(vGrey)))))))))))))