Unlock a world of possibilities! Login now and discover the exclusive benefits awaiting you.
- Qlik Community
- :
- All Forums
- :
- QlikView App Dev
- :
- Re: Set expression to represent shares of business...
- Subscribe to RSS Feed
- Mark Topic as New
- Mark Topic as Read
- Float this Topic for Current User
- Bookmark
- Subscribe
- Mute
- Printer Friendly Page
- Mark as New
- Bookmark
- Subscribe
- Mute
- Subscribe to RSS Feed
- Permalink
- Report Inappropriate Content
Set expression to represent shares of business groups region wise
Hi Qlik mates,
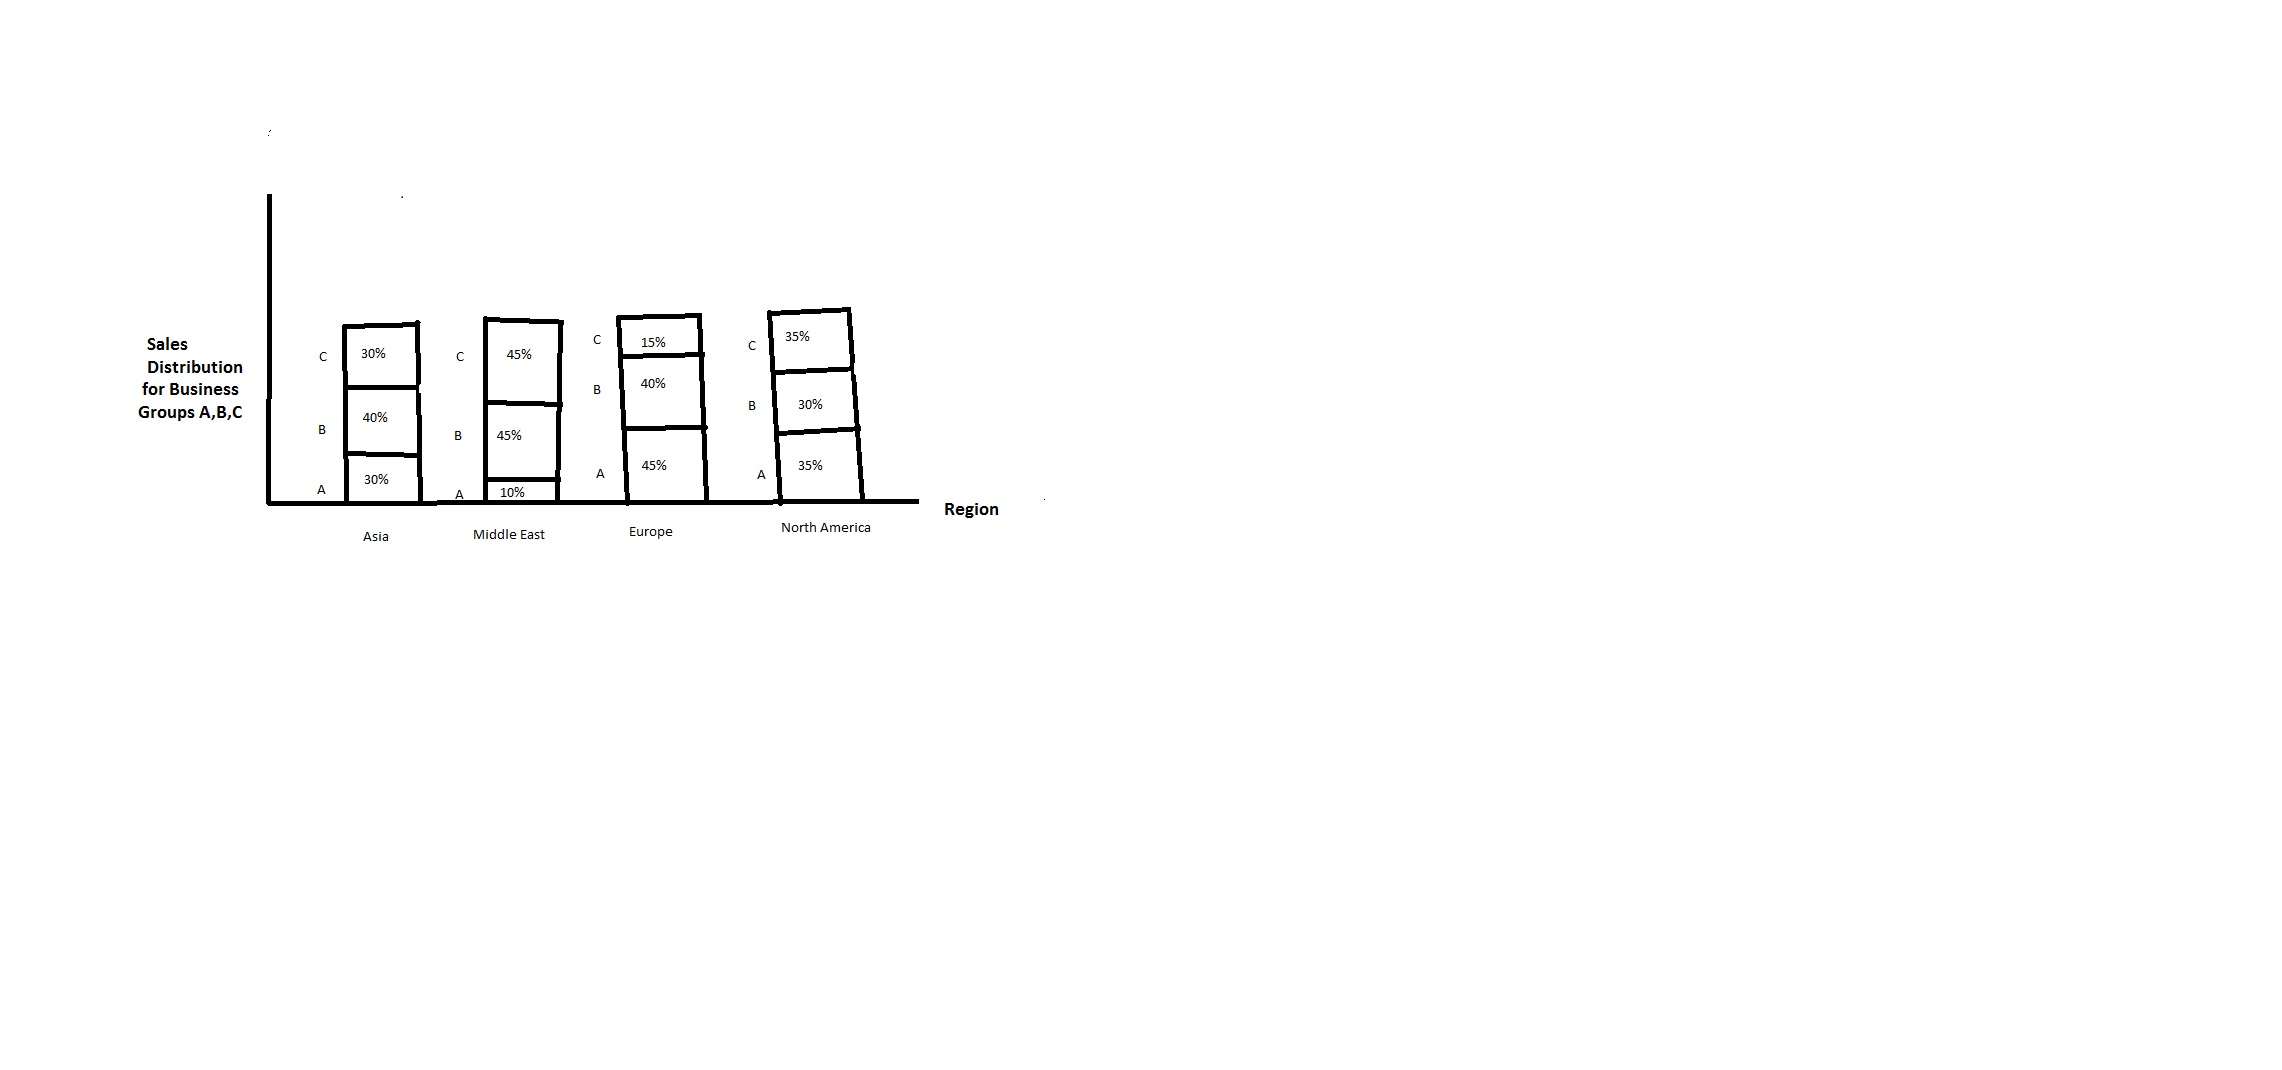
I face a strange scenario in my project for writing set analysis expression for representing shares of business groups A,B,C which amounts to 100% region wise such as Asia, Middle East, Europe and North America.
Please find the attached picture for detailed information.
Can somebody please advise the set expression for it.
Thanks in Advance
- Mark as New
- Bookmark
- Subscribe
- Mute
- Subscribe to RSS Feed
- Permalink
- Report Inappropriate Content
Would you be able to share some data to help you better?
- Mark as New
- Bookmark
- Subscribe
- Mute
- Subscribe to RSS Feed
- Permalink
- Report Inappropriate Content
Thanks Sunny.
I have 3 Business groups A,B, and C which spread across regions Asia, Middle East, Europe and North America. I want to represent sales percentages of business groups in these regions in a bar chart as attached in the discussion.
For example,
Asia -> A- 30% , B- 40%, C- 30%
Middle East -> A- 10%, B- 45%, C- 45%
Europe-> A- 45%, B- 40%, C- 15%
North America-> A- 35% ,B- 30%, C- 35%
I need to write a set expression to represent that in a bar chart. Could you please help me in doing so.
Thanks in Advance.
- Mark as New
- Bookmark
- Subscribe
- Mute
- Subscribe to RSS Feed
- Permalink
- Report Inappropriate Content
Hi,
Try like this
Dimension: Region, Business Group
Expression: Sum(Sales)/Sum(TOTAL <Region> Sales)
Note: Replace exact dimension and measure names in the above expressions.
Hope this helps you.
Regards,
jagan.
- Mark as New
- Bookmark
- Subscribe
- Mute
- Subscribe to RSS Feed
- Permalink
- Report Inappropriate Content
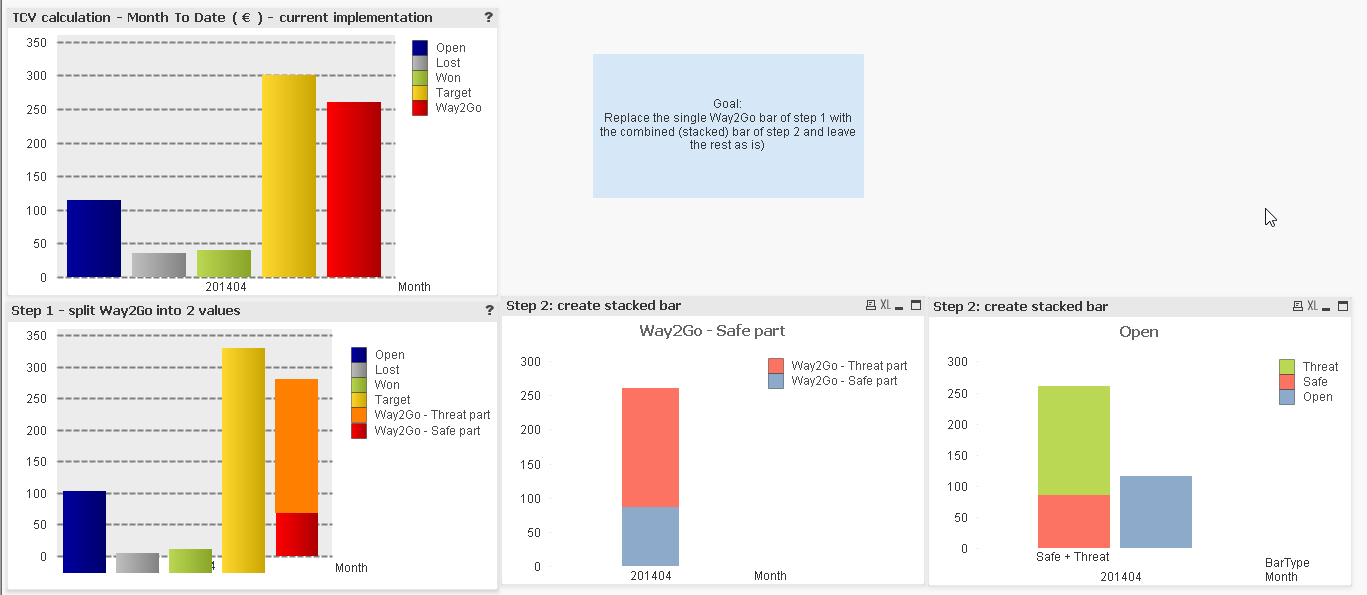
See this example.
- Mark as New
- Bookmark
- Subscribe
- Mute
- Subscribe to RSS Feed
- Permalink
- Report Inappropriate Content
Thank you all.
I got a clue that it can be managed with stacked option within style->subtype in bar chart properties.
The below values can be taken
Dimension: Region, Business Group
Expression: Sum(Sales)/Sum(TOTAL <Region> Sales)
- Mark as New
- Bookmark
- Subscribe
- Mute
- Subscribe to RSS Feed
- Permalink
- Report Inappropriate Content
Hi Laxmaiah,
If you got the answer please this thread by giving Correct and Helpful answers to the posts which helps you in finding the Answers, this helps others in finding the answers easily.
Regards,
Jagan.