Unlock a world of possibilities! Login now and discover the exclusive benefits awaiting you.
- Qlik Community
- :
- Forums
- :
- Analytics
- :
- New to Qlik Analytics
- :
- Re: Average comparation in bars graphic
- Subscribe to RSS Feed
- Mark Topic as New
- Mark Topic as Read
- Float this Topic for Current User
- Bookmark
- Subscribe
- Mute
- Printer Friendly Page
- Mark as New
- Bookmark
- Subscribe
- Mute
- Subscribe to RSS Feed
- Permalink
- Report Inappropriate Content
Average comparation in bars graphic
Good morning,
imagine a very simple table with three columns: EMPLOYEE - SKILL - SCORE.
I want to make a bar graphic with skills in Y and scores in X. Each bar would be the score average of each skill, that's easy. But I want to filter by employee in order to see his skills compared with the global average.
My problem is: when I select a user then the filter applies to the graphic averages, so global averages and employee averages are the same. I would need global averages stay fixed filtering employees.
Can I make this with the current table? Or should I add another table without users for the global average measure?
Thanks in advance.
Best regards,
David.
- Mark as New
- Bookmark
- Subscribe
- Mute
- Subscribe to RSS Feed
- Permalink
- Report Inappropriate Content
Hi David,
What you are looking for is totally possible.
check this example:
This gives you a comparison over the over all average and the employees individual scores scores.
Look at the QVF(attached) for more information.
Thanks,
Sangram
- Mark as New
- Bookmark
- Subscribe
- Mute
- Subscribe to RSS Feed
- Permalink
- Report Inappropriate Content
You could also make use of the reference line option to show changes over time as you expend your model to show contrast or a combo chart.
- Mark as New
- Bookmark
- Subscribe
- Mute
- Subscribe to RSS Feed
- Permalink
- Report Inappropriate Content
Thank you very much for your answers.
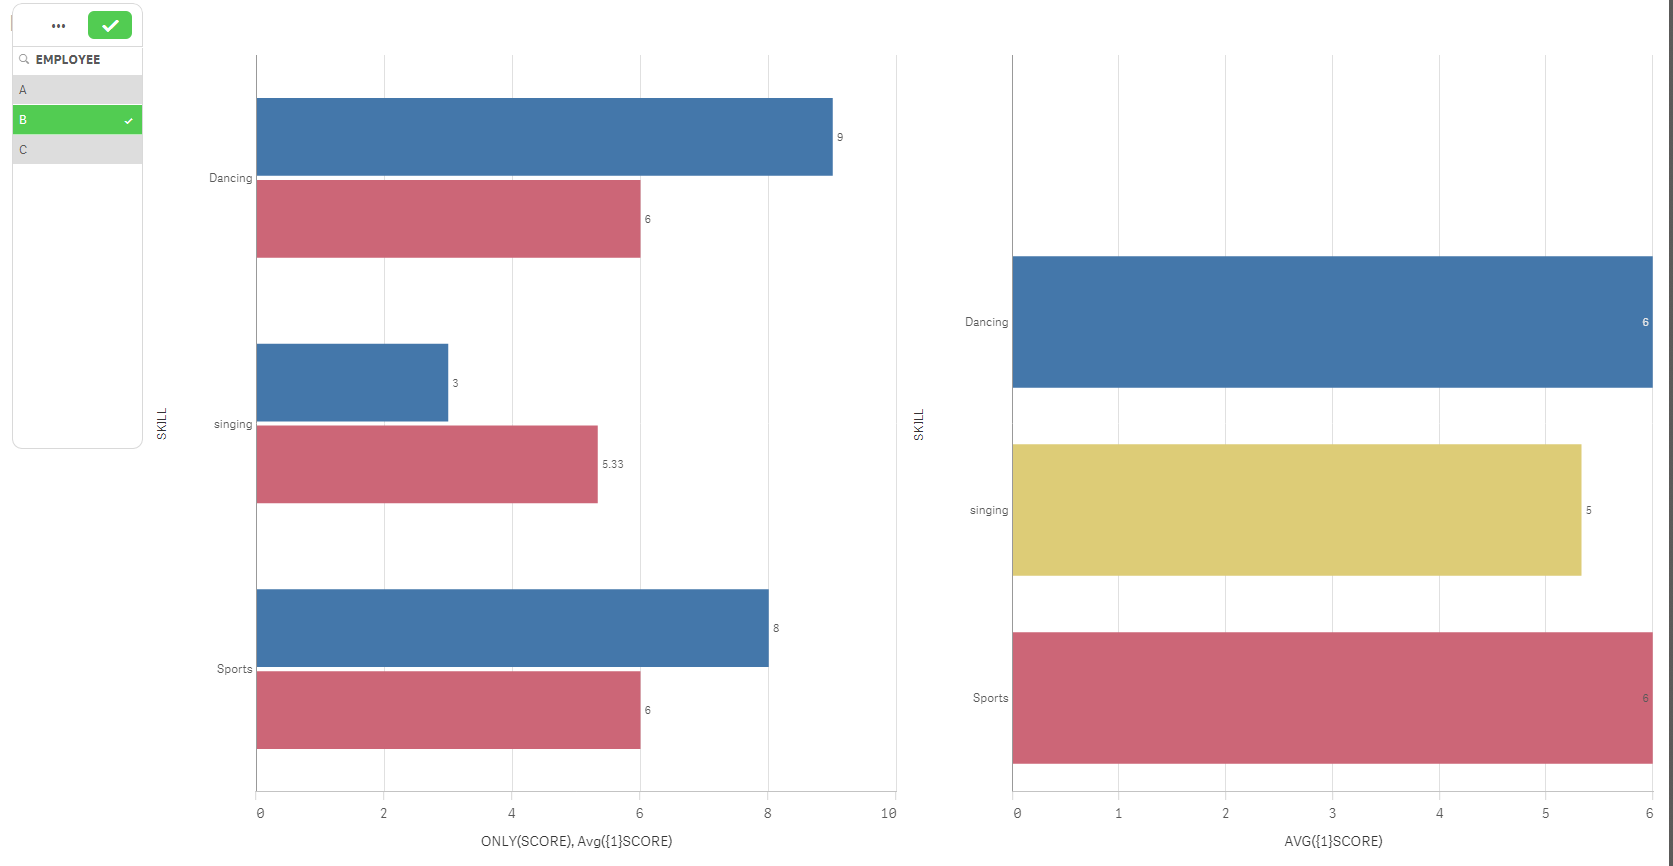
I attach an example in order to explain it clear. There are two graphics in this example (I don't care if the solution is for the first or for the second). The goal is that red measure marks the global average of each skill. I want to select one employee and that red measure stay with the global average in order to see (for every skill) the difference between the selected employee score and the global company score.
Please let me know if you need more details.
Best regards,
David.
- Mark as New
- Bookmark
- Subscribe
- Mute
- Subscribe to RSS Feed
- Permalink
- Report Inappropriate Content
There you go in both formats.
- Mark as New
- Bookmark
- Subscribe
- Mute
- Subscribe to RSS Feed
- Permalink
- Report Inappropriate Content
Hi David,
Hope you have got the issue resolved with the example I provided and the Skill test qvf which Andy attached.
- Mark as New
- Bookmark
- Subscribe
- Mute
- Subscribe to RSS Feed
- Permalink
- Report Inappropriate Content
Thank you Andy this example is perfect. Whats the meaning of {1} in Avg({1}[PUNTUACIÓN])?
- Mark as New
- Bookmark
- Subscribe
- Mute
- Subscribe to RSS Feed
- Permalink
- Report Inappropriate Content
iit's an example of set analysis the language Qlik uses to extend the functionality of its data model to handle alternate states, filters outside of ones defined by users. {1} basically tells qlik to return all values from the daat modelregardless of sections. {$} is return all values based on current sections.
HOpe this has helped. Please mark anyreplies you have found helpful/correct.