Unlock a world of possibilities! Login now and discover the exclusive benefits awaiting you.
- Qlik Community
- :
- All Forums
- :
- QlikView App Dev
- :
- Re: Cumulative Sum in Straight Table...
- Subscribe to RSS Feed
- Mark Topic as New
- Mark Topic as Read
- Float this Topic for Current User
- Bookmark
- Subscribe
- Mute
- Printer Friendly Page
- Mark as New
- Bookmark
- Subscribe
- Mute
- Subscribe to RSS Feed
- Permalink
- Report Inappropriate Content
Cumulative Sum in Straight Table...
Dear QV Experts,
I have a straight table filter based on the Top N Selections.
If Year, 2015 selected, Till Top 5 i can able to display five rows in a straight Table.
But when i want to view Top 6, i cant able to display six rows whereas when i select Top7, i can able to display seven rows.
Really Surprising.
Can you please suggest me on this.
Appreciate your prompt response.
Both the qvw, spreadsheet enclosed.
Regards,
SasiR
- Tags:
- new_to_qlikview
- Mark as New
- Bookmark
- Subscribe
- Mute
- Subscribe to RSS Feed
- Permalink
- Report Inappropriate Content
- Mark as New
- Bookmark
- Subscribe
- Mute
- Subscribe to RSS Feed
- Permalink
- Report Inappropriate Content
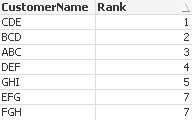
New improvised Calculated Dimension:
=If(Aggr(Rank(RangeSum(Sum(Sales),
Sum({<Year = {$(=Year-1)}>}Sales)/10000,
Sum({<Year = {$(=Year-2)}>}Sales)/100000,
Sum({<CustomerName = e(CustomerName), Year>} 0))) <= vTopX, CustomerName), CustomerName)
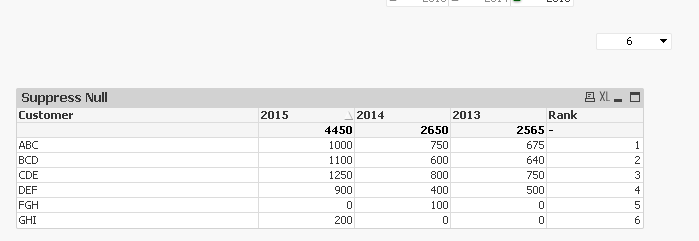
Since EFG and FGH were both 0s for 2015, it was assigning same ranks to both of them. I am not sure what you criteria is, but I used 2014 and 2013 numbers to assign rank when 2015 have same number. 2014 took a higher priority (divided by a smaller number 10,000) and 2013 took a lower priority (divided by a larger number 100,000)
HTH
Best,
Sunny
- Mark as New
- Bookmark
- Subscribe
- Mute
- Subscribe to RSS Feed
- Permalink
- Report Inappropriate Content
...and ranks for same results assume the highest rank which is 7 when you select Top7. This is what your Calculated Dimension produces to select CustomerNames. Quite different from the other Rank expression.
- Mark as New
- Bookmark
- Subscribe
- Mute
- Subscribe to RSS Feed
- Permalink
- Report Inappropriate Content
just need small change in calculated dimension
=If(Aggr(Rank(RangeSum(Sum(Sales), Sum({<CustomerName = e(CustomerName), Year>} 0)),4) <= vTopX, CustomerName), CustomerName)