Unlock a world of possibilities! Login now and discover the exclusive benefits awaiting you.
- Qlik Community
- :
- All Forums
- :
- Qlik NPrinting
- :
- Re: NPrinting Make Table Rows to Emulate Line Wrap...
- Subscribe to RSS Feed
- Mark Topic as New
- Mark Topic as Read
- Float this Topic for Current User
- Bookmark
- Subscribe
- Mute
- Printer Friendly Page
- Mark as New
- Bookmark
- Subscribe
- Mute
- Subscribe to RSS Feed
- Permalink
- Report Inappropriate Content
NPrinting Make Table Rows to Emulate Line Wrap In Excel
Hello - I reworked a recent Qlikview document to reduce the NPrinting Levels and time it takes to generate an NPrinting report. The solution was to create a straight table with some dimensions aggregated to produce the rows I need to feed the report. The issue is there are ~14 columns in the Qlikview table and the goal is to break up the row under a level in the Excel template to emulate a "line wrap" with the first 7 columns on the first line, the second 7 right below on line 2, and loop over all rows for the level.
In the Excel template I have:
<Level_1>
<Column1> , <Column2> ... <Column7>
<Column8> < Column9> ... <Column 14>
</Level_1>
Say a couple rows of data in the qlikview table (14 Columns) look like:
1: A1 .... A14
2: B1 ... B14
I was expecting in the NPrinting Report under the level to see output of:
A1....A7
A8....A14
B1....B7
B8....B14
But what I see is:
A1....A7
B1....B7
A8....B14
B8....B14
It is possible to emulate this line wrap scenario in Nprinting? It feels like I'm missing a checkbox or something for how the row columns stay together? Thanks for any thoughts on the subject. Mike
- Tags:
- nprinting
Accepted Solutions
- Mark as New
- Bookmark
- Subscribe
- Mute
- Subscribe to RSS Feed
- Permalink
- Report Inappropriate Content
Hi Mike,
Welcome to NPrinting. I have a similar project that I am working on with 23 columns and a similar requirement. I have attached two screen shots here that seem to solve your issue. Please review and let me know.
I put the headers above the level and each level is a unique number. In this case OrlID
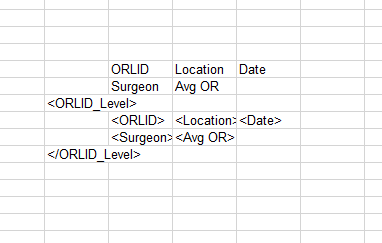
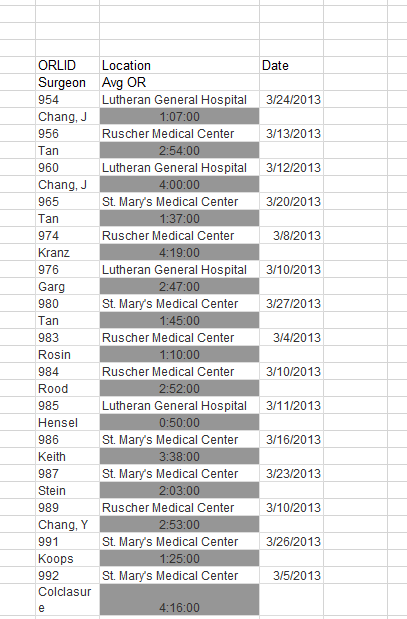
Here is the result in Excel. Sorry this is not pretty. This is just some test data from the Surgical Demo Dashboard
- Mark as New
- Bookmark
- Subscribe
- Mute
- Subscribe to RSS Feed
- Permalink
- Report Inappropriate Content
Hi Mike,
Welcome to NPrinting. I have a similar project that I am working on with 23 columns and a similar requirement. I have attached two screen shots here that seem to solve your issue. Please review and let me know.
I put the headers above the level and each level is a unique number. In this case OrlID
Here is the result in Excel. Sorry this is not pretty. This is just some test data from the Surgical Demo Dashboard
- Mark as New
- Bookmark
- Subscribe
- Mute
- Subscribe to RSS Feed
- Permalink
- Report Inappropriate Content
Mike, thanks for the quick reply and example, much appreciated. It would appear this is working for you in the way I’d like to see as well, which is great. I may have left out a critical detail (sorry for the omission, it was late…), I am repeating of a few table dimension columns on line 1, but not on line 2, so the user knows the line has “wrapped”. This might be the difference in what I am seeing. I’m going to experiment with taking the Dim Columns out as I suspect they are triggering some type of grouping of the “line 1s” under the level. I’ll update shortly...
The actually QV table is now:
[Dim 1] (Unique), [Dim2] (Not Unique), [Dim 3] (Not Unique), Expr/Column 1,…. Expr/Column 14
Sample data in table:
D1A, D2,D3, E1, E2….E14
D1B, D2,D3, E1, E2….E14
Etc…
In NPrinting, the level [Dim2] is a unique selection in my QV list box [Dim2], but NOT unique in the table result. Dim 1 is then the unique key for the table row (but not a level). I think its use of the dimension columns on line 1 could cause it to print all of line 1s together then line2s
<Dim2>
<Dim1> <Dim2> <Dim3> <Column1>…<Column 7>
<Column8>….<Column14>
</Dim2>
- Mark as New
- Bookmark
- Subscribe
- Mute
- Subscribe to RSS Feed
- Permalink
- Report Inappropriate Content
Those multiple dimensions sure do make it challenging. Can you take a screen shot of the first 5 or so rows in your table in QV, so I can get a better idea of what you are doing.
- Mark as New
- Bookmark
- Subscribe
- Mute
- Subscribe to RSS Feed
- Permalink
- Report Inappropriate Content
Did you get the issue resolved? I am interested as I will be doing something similar to this in the near future.
- Mark as New
- Bookmark
- Subscribe
- Mute
- Subscribe to RSS Feed
- Permalink
- Report Inappropriate Content
I have 2 ways I might go because the deadline is looming for this project:
Option 1: Is to keep experimenting with NPrinting to see if adding a RowNo() or some unique key to the row or replacing repeating dimensions with a variable would cause it to work per your example.
Option 2: which I actually have working because I was getting nervous and knew how to do this, is to simulate rows line 1&2 in the Qlik table using IF logic to set the calculations based on a higher level grouping dimension I call rowgroup. IF row is in rowgroup 1, use expression 1, if rowgroup 2, use expression 2, etc... Then I can convert the dimension columns back to expression columns in the table and just send it right to Nprinting as is without a line 2 in the template.
I'll keep updating the thread on how Option 1 so I can get back to a pure Nprinting solution as I remain curious why this isn't working as I am expecting.
Mike
- Mark as New
- Bookmark
- Subscribe
- Mute
- Subscribe to RSS Feed
- Permalink
- Report Inappropriate Content
Just to close this discussion for now, I never did get the line wrap working properly in the NPrinting template where the table had more than one dimension, but there was nothing wrong with the suggested answer as this is how the NPrinting product claims it should work as well.
I ended up just using a qlik table and a "row group" dimension (1 for row 1, 2 for row 2) with some IF, AGGR and NUM formatting statements to break things into 2 rows with different calculations per cell depending on the rowgroup and sent the qlikview table directly to NPrinting with a single row in the excel template. The report is working fine and the client accepted the design. I may try this scenario again in v17 when it becomes GA just to see if I can avoid this in the future and put another group of expressions for a large qlikview table on a 2nd row. Thanks again Mike for your responses.
Mike
- Mark as New
- Bookmark
- Subscribe
- Mute
- Subscribe to RSS Feed
- Permalink
- Report Inappropriate Content
Glad to hear you came up with a work around. I too am looking forward to Version 17.