Unlock a world of possibilities! Login now and discover the exclusive benefits awaiting you.
- Qlik Community
- :
- All Forums
- :
- QlikView Integrations
- :
- Re: Google Maps - Marker
- Subscribe to RSS Feed
- Mark Topic as New
- Mark Topic as Read
- Float this Topic for Current User
- Bookmark
- Subscribe
- Mute
- Printer Friendly Page
- Mark as New
- Bookmark
- Subscribe
- Mute
- Subscribe to RSS Feed
- Permalink
- Report Inappropriate Content
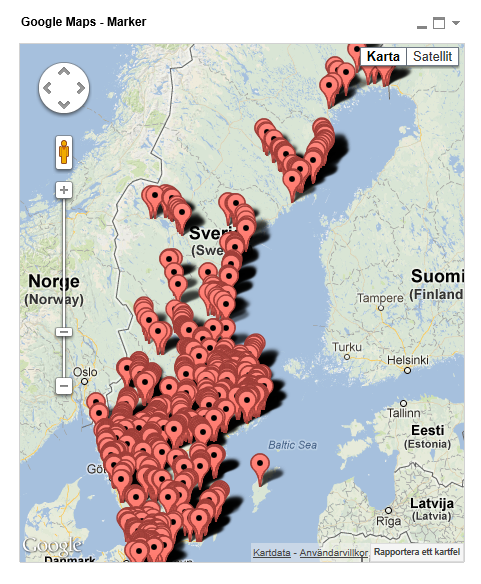
Google Maps - Marker
Google Maps Extension with Markers.
QlikTech takes no responsibility for any code and QlikTech Support Agreement does not cover issues with this extension.
Please review Googles license agreement before you put this into production.
Introduction
This is a QlikView extension object that integrates Google Maps Javascript API V3 into QlikView.
Load a set a coordinates into QlikView and visualize them together with this extension. This extension will plot every single data point as a marker on the map so if you have a large amount of markers please be aware that it might have some performance impact. If you are experiencing performance issues look into the cluster extension instead: http://community.qlik.com/message/325640
You can either use the extension 'as is' or use it as a base to further customize it to fit your needs.
Custom Markers
Added support for custom markers images. In the properties dialog you now have the option to specify a custom image.
You can either have a static image or let the expression evaluate one for you, for example:
=If(MyExpression > 1, 'http://image_for_true', 'http://image_for_false'). If you do not specify an url or enter an invalid one the extension will fallback to the standard marker.
Supported image extensions are bmp, jpg, jpeg, tiff, png and gif.
You can host the images through the qlikview webserver or through IIS.
If you build something awesome please share it with the community!
Live long and prosper.
- Mark as New
- Bookmark
- Subscribe
- Mute
- Subscribe to RSS Feed
- Permalink
- Report Inappropriate Content
If you put two listboxes with the latitude and longitude and you then click in your original field/listboxs does your latitude and longitude values filter accordingly?
- Mark as New
- Bookmark
- Subscribe
- Mute
- Subscribe to RSS Feed
- Permalink
- Report Inappropriate Content
Hi Alex,
Yes.Latitude and longitude gets filtered accordingly....Below is the code.Please let me know where to modify or add the Region name column because have already tried adding it an its still not working...
Definition:
<ExtensionObject xmlns:xsi="http://www.w3.org/2001/XMLSchema-instance" xsi:noNamespaceSchemaLocation="Definition.xsd" Label="Mapbox Extension" Description="Mapbox Web Maps with Marker V2" PageHeight="10000">
<Dimension Label="Latitude" Initial="Latitude" DropTarget="Latitude" />
<Dimension Label="Longitude" Initial="Longitude" DropTarget="Longitude" />
<Measurement Label="Popup Title" Initial="Popup Title" />
<Measurement Label="Popup description" Initial="Popup Description"/>
<Text Label="Map Key" Type="text" Initial="" Expression="put map key here"/>
<Text Label="Access Token" Type="text" Initial="" Expression="put default access token here"/>
<Text Label="Use Clusters" Type="checkbox" Initial="1" Expression="1"/>
<Text Label="Initial Zoom Level" Type="text" Initial="1" Expression="1"/>
<Text Label="Initial Starting Point Latitude" Type="text" Initial="" Expression="0"/>
<Text Label="Initial Starting Point Longitude" Type="text" Initial="" Expression="0"/>
<Text Label="Icon Display" Type="text" Initial="marker" Expression="marker"/>
<Text Label="Auto fit bounds on/off" Type="checkbox" Initial="1" Expression="1"/>
<Initiate Name="Caption.Text" Value="Mapbox Extension"/>
</ExtensionObject>
Jscript:
//Mapbox Web Maps API
//Declare variables for unique divIDs
var r=Math.floor(Math.random()*10001);
var divName = "div" + r;
//Load Mapbox scripts
Qva.LoadScript('https://api.tiles.mapbox.com/mapbox.js/v2.1.2/mapbox.js', function(){
Qva.LoadScript('https://api.tiles.mapbox.com/mapbox.js/plugins/leaflet-markercluster/v0.4.0/leaflet.markercluster.js', function() {
Qva.LoadScript('https://api.tiles.mapbox.com/mapbox.js/plugins/leaflet-zoomslider/v0.7.0/L.Control.Zoomslider.js', function() {
Qva.AddExtension('Mapbox Extension', Map_Done)
});
});
});
function Map_Done() {
//LOAD CSS sheets
Qva.LoadCSS('https://api.tiles.mapbox.com/mapbox.js/v2.1.2/mapbox.css');
Qva.LoadCSS('https://api.tiles.mapbox.com/mapbox.js/plugins/leaflet-markercluster/v0.4.0/MarkerCluster.css');
Qva.LoadCSS('https://api.tiles.mapbox.com/mapbox.js/plugins/leaflet-markercluster/v0.4.0/MarkerCluster.Default.cs...
Qva.LoadCSS('https://api.tiles.mapbox.com/mapbox.js/plugins/leaflet-zoomslider/v0.7.0/L.Control.Zoomslider.css');
//Check for existing map canvas.
if (this.Element.children.length == 0) {
var ui = document.createElement("div");
ui.setAttribute("id",divName);
ui.setAttribute("style","position:absolute; top:0; bottom:0; width:100%;");
this.Element.appendChild(ui);
} else {
document.getElementById(divName).innerHTML = '';
}
//// Mapkey used to point at a specific map
var MapKey = this.Layout.Text0.text ;
///// AccessToken new for mapbox 2.1.2
var AccessToken = this.Layout.Text1.text ;
//Create marker array and cycle through your rows.
var clustergroup = new L.MarkerClusterGroup();
//Initiate AccessToken
L.mapbox.accessToken = AccessToken;
//Initiate map with MapKey setting the zoom control off because we are using a customer slider instead
//added in is also the geocodercontrol which enables the user to search for a country
var mapbox = L.mapbox.map(divName, MapKey,{zoomControl: false})
.addControl(L.mapbox.geocoderControl('mapbox.places-v1', {
autocomplete: true
}));
L.control.zoomslider({ position: 'topright'}).addTo(mapbox);
var markerarray = [];
//Cluster toggle 0 = off / 1 = on
if (this.Layout.Text2.text == 0)
{
//Loop through data create a geoJson data set with additional features
for (var i = 0; i < this.Data.Rows.length; i++)
{
var row = this.Data.Rows;
//var latLng = new L.LatLng(row[1].text,row[0].text);
var row0data = row[0].text;
var row1data = row[1].text;
var row2data = row[2].text;
var row3data = row[3].text;
var row6data = this.Layout.Text6.text;
//Check if longitude and latitude exist and are not null
if (row1data == "-") {
row1data = 0;
}
if (row0data == "-") {
row0data = 0;
}
//set the popup details
row3data = "<b>"+row2data+"<\/b><p><p><font size=2>"+row3data+"<\/font>"
//Create geoJson data set feature collection
var data =
{ "type": "FeatureCollection",
"features": [
{
"type": "Feature",
"geometry":
{
"type": "Point",
"coordinates": [row1data,row0data],
"LatLing": [row0data,row1data]
},
"properties":
{
// "title": row2data, title makes the tooltips re-appear so had to use html to create the same effect in row3data
"description" : row3data,
"marker-color": "#81DAF5",
"marker-size": "large",
"marker-symbol": row6data
}
}
]
}
//Create geoJson layer and collect the latling data for auto setting the boundaries
var geojsonLayer = new L.geoJson(data, {
onEachFeature: function(feature, Layer){
markerarray.push(feature.geometry.LatLing);
}
}
);
// set data on map using the feature layer to include all the data included in the geoJson
var featureLayer = L.mapbox.featureLayer(data).addTo(mapbox);
} ;
}
else
{
//Loop through data and use the clustergroup css plug in to create cluster groups
for (var i = 0; i < this.Data.Rows.length; i++) {
var row = this.Data.Rows;
var row0data = row[0].text;
var row1data = row[1].text;
var row2data = row[2].text;
var row3data = row[3].text;
var row6data = this.Layout.Text6.text;
if (row1data == "-") {
row1data = 0;
}
if (row0data == "-") {
row0data = 0;
}
row3data = "<b>"+row2data+"<\/b><p><p><font size=2>"+row3data+"<\/font>"
var data =
{ "type": "FeatureCollection",
"features": [
{
"type": "Feature",
"geometry":
{
"type": "Point",
"coordinates": [row1data,row0data],
"LatLing": [row0data,row1data]
// "coordinates": [-77.03238901390978,38.913188059745586]
},
"properties":
{
// "title": row2data, title makes the tooltips re-appear so had to use html to create the same effect in row3data
"description": row3data,
"marker-color": "#81DAF5",
"marker-size": "large",
"marker-symbol": row6data
}
}
]
}
var featureLayer = L.mapbox.featureLayer(data);
//.addTo(mapbox);
clustergroup.addLayer(featureLayer);
}
//Set cluster on markers layer
mapbox.addLayer(clustergroup);
}
var Zoomlevel = this.Layout.Text3.text;
var startingpointlat = this.Layout.Text4.text;
var startingpointlong = this.Layout.Text5.text;
if (Zoomlevel == "-"){zoomlevel = 1;}else{};
// Check the configuration of the map for clusters on/off and autofit boundaries on/off
if (this.Layout.Text2.text == 0)
{
if (this.Layout.Text7.text == 0){
//This sets the view to the user defined starting latitude and longitude converted to LatLng(very important when setting coordinates on a map)
//it also includes the customisable zoom level which extends from 0 to 19
mapbox.setView(L.latLng(startingpointlat,startingpointlong),Zoomlevel);
}
else
{
mapbox.fitBounds(markerarray);
}
}
else
{
mapbox.fitBounds(clustergroup.getBounds());
}
}
- Mark as New
- Bookmark
- Subscribe
- Mute
- Subscribe to RSS Feed
- Permalink
- Report Inappropriate Content
Thanks. I'll try.
- Mark as New
- Bookmark
- Subscribe
- Mute
- Subscribe to RSS Feed
- Permalink
- Report Inappropriate Content
Hey,
Well I'm not sure, that is not the extension that is posted in this thread or written by me.
- Mark as New
- Bookmark
- Subscribe
- Mute
- Subscribe to RSS Feed
- Permalink
- Report Inappropriate Content
Hi Alex,
This code is based on the Cloudmade maps example created by Ralf Becher - ralf.becher@tiq-solutions.de - TIQ Solutions, Leipzig, Germany and the Google Maps example created by you.Well am not sure who has developed this code.Since its not interactive with qlikview data have been asked to modify this.So do you have any clue how to make it interactive so that map get refereshed on each listbox selection.
Thanks ....
- Mark as New
- Bookmark
- Subscribe
- Mute
- Subscribe to RSS Feed
- Permalink
- Report Inappropriate Content
Sorry, haven't worked with their API before.
- Mark as New
- Bookmark
- Subscribe
- Mute
- Subscribe to RSS Feed
- Permalink
- Report Inappropriate Content
Hi Alex,
No problem.Can you just tell me how/where to call the qlikview column in the script in general.
so that map could refreshed on each list box selection.
Thanks
- Mark as New
- Bookmark
- Subscribe
- Mute
- Subscribe to RSS Feed
- Permalink
- Report Inappropriate Content
Hi Alex,
Can you just tell me how to refresh the report each time a selection is made in order to refresh the map.
Thanks
- Mark as New
- Bookmark
- Subscribe
- Mute
- Subscribe to RSS Feed
- Permalink
- Report Inappropriate Content
That is default behavior in Qlik, you can't opt out on in unless your data is not associated with each other which you previously said it were. As I said, I would recommend you contact the extension author.
- Mark as New
- Bookmark
- Subscribe
- Mute
- Subscribe to RSS Feed
- Permalink
- Report Inappropriate Content
Hi Alex,
I have a question. Question is not concerned with this followup.
Scenario:
I have a Google Map Cluster-QV11 to show #Agents in different areas in US map.
It used to show Bubble with number in the middle. When I drill down to a particular state where there is only one agent lives. Then map shows me Marker rather than Bubble.
Question:
Q.1.Is there anyway we can change the every Marker with the Bubble that Google Cluster Map used?
Q.2. I want to give following condition - Is it possible in Custom Marker URL Option in Google Cluster Map
if(count(Agent) = 1,'https://<servername>/qlikview/image.png')
Don't want to give else part because I want Map populate rest of the data as it used to be.
Thanks & Regards,
Deepac Bangarwa