Unlock a world of possibilities! Login now and discover the exclusive benefits awaiting you.
- Qlik Community
- :
- All Forums
- :
- QlikView App Dev
- :
- Re: Relative + Absolute values in diagram - Sync l...
- Subscribe to RSS Feed
- Mark Topic as New
- Mark Topic as Read
- Float this Topic for Current User
- Bookmark
- Subscribe
- Mute
- Printer Friendly Page
- Mark as New
- Bookmark
- Subscribe
- Mute
- Subscribe to RSS Feed
- Permalink
- Report Inappropriate Content
Relative + Absolute values in diagram - Sync left & right axis + 100% issue
Accepted Solutions
- Mark as New
- Bookmark
- Subscribe
- Mute
- Subscribe to RSS Feed
- Permalink
- Report Inappropriate Content
It's quite difficult to understand your data and what do you want to achieve but you need to consider your data-quality (there are some missing values respectively NULL between your used dimensions and the measure - how need this to be considered?) and possible selections. In your case returned the variable eMaxSoll not the max. value of your normal sum-expression which results in not getting the 100%. I have the variable extended to:
Sum(TOTAL Aggr( Sum({< %IWeek = p(%IWeek), IStufenWk.MS = p(IStufenWk.MS)>}[Config_Soll_km.Soll-Wert] * vAnzahl_SollPF), %IWeek, IStufenWk.MS))
and it worked for your reduced datamodel and I think you could adapt it if you extend more complexity:
- Marcus
- Mark as New
- Bookmark
- Subscribe
- Mute
- Subscribe to RSS Feed
- Permalink
- Report Inappropriate Content
It's not quite clear but I would rather use this as eMaxSoll:
Sum( TOTAL [Config_Soll.Soll-Wert]*vAnzahl_SollPF)
instead of the aggr-function.
- Marcus
- Mark as New
- Bookmark
- Subscribe
- Mute
- Subscribe to RSS Feed
- Permalink
- Report Inappropriate Content
Hi Marcus
thanks for your answer - unfortunately it does not work out:
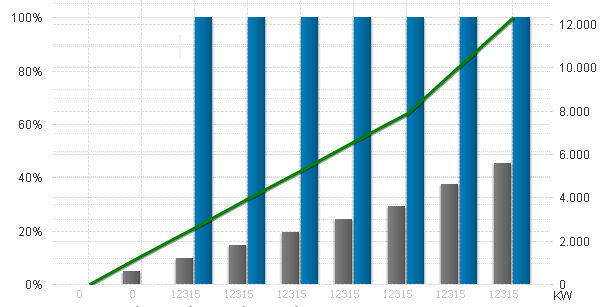
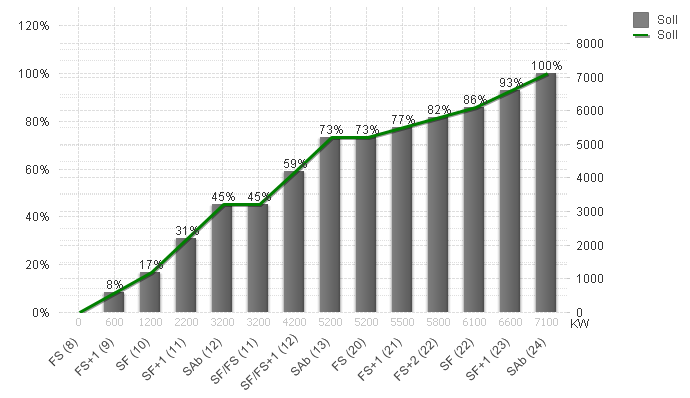
See e.g. In this example:
=$(eMaxSoll([Config_Soll_km.Soll-Wert])) RETURNS 3200
Sum( TOTAL [Config_Soll_km.Soll-Wert]*vAnzahl_SollPF) RETURNS 1600
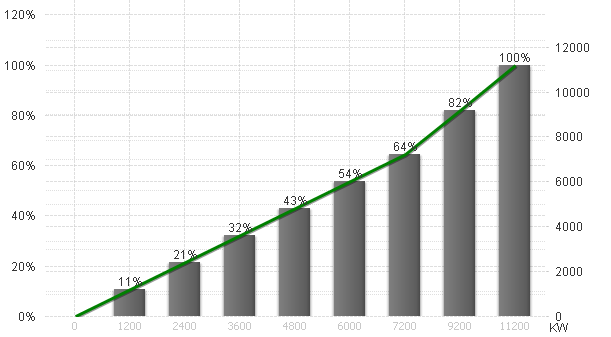
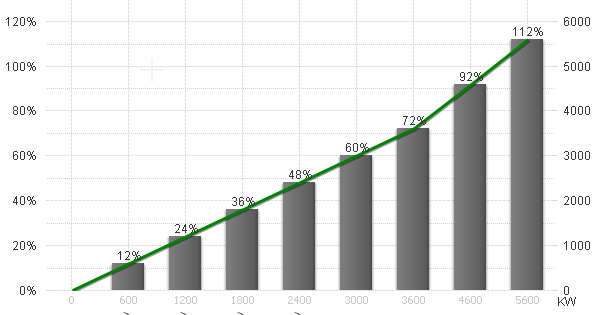
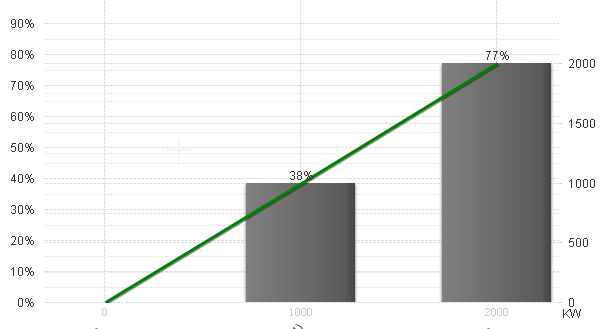
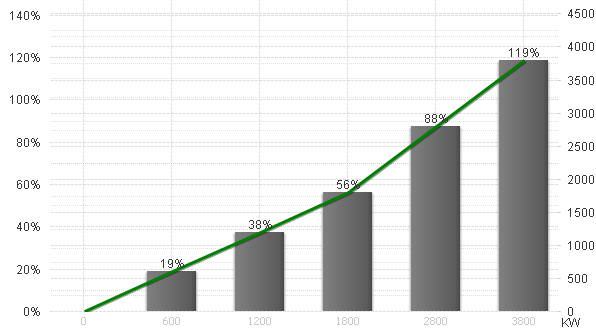
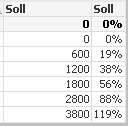
THE CORRECT VALUE WOULD BE 3800...
Any other idea?
- Mark as New
- Bookmark
- Subscribe
- Mute
- Subscribe to RSS Feed
- Permalink
- Report Inappropriate Content
Please provide a small example-app with a few inline-tables which demonstrate this problem.
- Marcus
- Mark as New
- Bookmark
- Subscribe
- Mute
- Subscribe to RSS Feed
- Permalink
- Report Inappropriate Content
due to company policies I had to reduce data sets and "anonymize" them. Does this QVW work for you - you only cannot do a reload, but work with the data already loaded.
Thanks a lot
Oliver
- Mark as New
- Bookmark
- Subscribe
- Mute
- Subscribe to RSS Feed
- Permalink
- Report Inappropriate Content
It's quite difficult to understand your data and what do you want to achieve but you need to consider your data-quality (there are some missing values respectively NULL between your used dimensions and the measure - how need this to be considered?) and possible selections. In your case returned the variable eMaxSoll not the max. value of your normal sum-expression which results in not getting the 100%. I have the variable extended to:
Sum(TOTAL Aggr( Sum({< %IWeek = p(%IWeek), IStufenWk.MS = p(IStufenWk.MS)>}[Config_Soll_km.Soll-Wert] * vAnzahl_SollPF), %IWeek, IStufenWk.MS))
and it worked for your reduced datamodel and I think you could adapt it if you extend more complexity:
- Marcus
- Mark as New
- Bookmark
- Subscribe
- Mute
- Subscribe to RSS Feed
- Permalink
- Report Inappropriate Content
Hi Marcus,
thanks a lot for your great help!!!! - even though I don't understand yet the formula - it does work also with my complete data model!!!!! 🙂
Best regards Oliver