Unlock a world of possibilities! Login now and discover the exclusive benefits awaiting you.
- Qlik Community
- :
- All Forums
- :
- QlikView App Dev
- :
- Re: Set Analysis Syntax
- Subscribe to RSS Feed
- Mark Topic as New
- Mark Topic as Read
- Float this Topic for Current User
- Bookmark
- Subscribe
- Mute
- Printer Friendly Page
- Mark as New
- Bookmark
- Subscribe
- Mute
- Subscribe to RSS Feed
- Permalink
- Report Inappropriate Content
Set Analysis Syntax
Hi everyone... I am trying to determine the correct Set Analysis syntax for the following situation:
My application has two views - one that looks at the sum(WORKFLOW_DURATION) based on the CUR_WORKFLOW_STEP_NAME and one based on the historical WORKFLOW_STEP_NAME.
In my example, if you select REQUEST_ID 181997, you can see that the historical WORKFLOW_STEP_NAME chart looks correct.
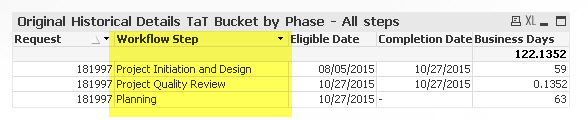
However, the CUR_WORKFLOW_STEP_NAME chart shows the Current Workflow repeating because that's the phase it is currently in but it still sums up the Business Days Workflow Duration for each of the other steps.
I want to see only one line that sums up Business Days Workflow Duration where the CUR_WORKFLOW_STEP_NAME=WORKFLOW_STEP_NAME instead of this:
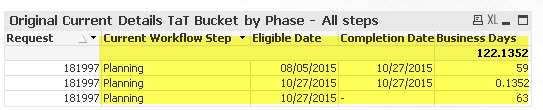
t's possible that a workflow step could repeat. In the case where CUR_WORKFLOW_STEP_NAME=WORKFLOW_STEP_NAME, I would want to seem the sum of the aggregate workflow duration.
A null Completion date also means a step is current.
Thanks!
- « Previous Replies
-
- 1
- 2
- Next Replies »
- Mark as New
- Bookmark
- Subscribe
- Mute
- Subscribe to RSS Feed
- Permalink
- Report Inappropriate Content
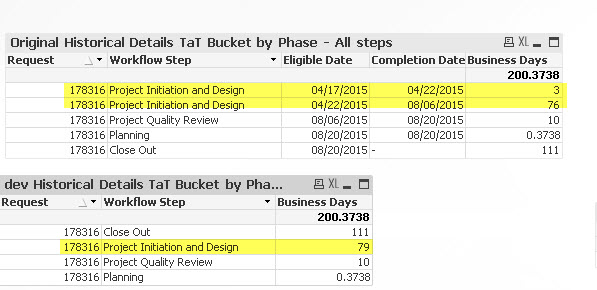
I would add a field in the script:
if(CUR_WORKFLOW_STEP_NAME=WORKFLOW_STEP_NAME, 1, 0) as Flag_CurrentStep
and then in the chart:
sum({<Flag_CurrentStep={1}>}WORKFLOW_DURATION)
-Rob
- Mark as New
- Bookmark
- Subscribe
- Mute
- Subscribe to RSS Feed
- Permalink
- Report Inappropriate Content
Rob,
That works great for the Current chart. Maybe the best solution for the Historical view is to remove the date fields to get the aggregate sum if a step was repeated but is there a way to keep the date fields and still get the right totals?
- Mark as New
- Bookmark
- Subscribe
- Mute
- Subscribe to RSS Feed
- Permalink
- Report Inappropriate Content
Do you only want one historical line per Step name? If so which date do you want to show? High, low or both?
-Rob
- Mark as New
- Bookmark
- Subscribe
- Mute
- Subscribe to RSS Feed
- Permalink
- Report Inappropriate Content
After talking to my customer, I am going to show them on one line but remove the dates from the historical view for now so that makes it easier.
- Mark as New
- Bookmark
- Subscribe
- Mute
- Subscribe to RSS Feed
- Permalink
- Report Inappropriate Content
Thank you!
- Mark as New
- Bookmark
- Subscribe
- Mute
- Subscribe to RSS Feed
- Permalink
- Report Inappropriate Content
Glad you've got it resolved. For the record, I was going to suggest handling the dates with expressions of
min(WORKFLOW_STEP_ELIG_DATE)
max(WORKFLOW_STEP_COMP_DATE)
-Rob
- Mark as New
- Bookmark
- Subscribe
- Mute
- Subscribe to RSS Feed
- Permalink
- Report Inappropriate Content
The only potential issue here is when the step repeats but it isn't sequential... so:
Step A 1/1/15-1/31/15
Step B 2/1/15-3/31/15
Step A 4/1/15-5/30/15
Would look like:
Step A 1/1/15-5/30/15
- Mark as New
- Bookmark
- Subscribe
- Mute
- Subscribe to RSS Feed
- Permalink
- Report Inappropriate Content
An alternative would be to use concat to show multiple dates.
concat(WORKFLOW_STEP_ELIG_DATE, chr(10))
max(WORKFLOW_STEP_COMP_DATE, chr(10))
The chr(10) is a newline so they will only show when hovered over.
-Rob
- Mark as New
- Bookmark
- Subscribe
- Mute
- Subscribe to RSS Feed
- Permalink
- Report Inappropriate Content
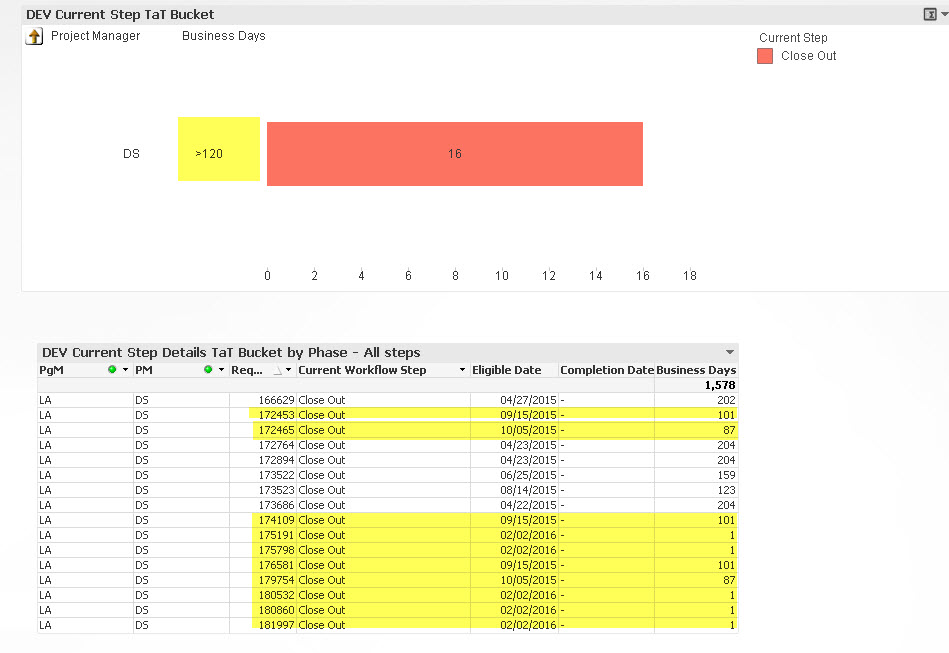
Rob,
I've attached a new sample file with the Flag.
As you can see, it seems to be counting REQUEST_IDs that are not within the Turn Around Time indicated in the class.
For example, I would expect to see 16 REQUEST_IDs in Close Out for more than 120 days, but in reality there only appear to be 6.
How do I get both charts to reflect the correct counts?
Thanks!
- « Previous Replies
-
- 1
- 2
- Next Replies »