Unlock a world of possibilities! Login now and discover the exclusive benefits awaiting you.
- Qlik Community
- :
- Forums
- :
- Groups
- :
- Location and Language
- :
- Francophones
- :
- Re: growth rates as expression in line graph with ...
- Subscribe to RSS Feed
- Mark Topic as New
- Mark Topic as Read
- Float this Topic for Current User
- Bookmark
- Subscribe
- Mute
- Printer Friendly Page
- Feature this Topic
- Mark as New
- Bookmark
- Subscribe
- Mute
- Subscribe to RSS Feed
- Permalink
- Report Inappropriate Content
growth rates as expression in line graph with periods in horizontal axis
hi, let say I have a regular master calandar with Period as 201506,201507 and periodID, year, month, etc...
in a set analysis I can for a selection find max of the year and max of year -1, in order to evaluate a growth rate fine !
I can do it for month, YTD etc...
I STILL CAN'T MANAGE TO HAVE A GRAPH THAT SHOWS THE EXPRESSION OVER PERIODS IN HORIZONTAL AXIS
CAN YOU PLEASE HELP CAUSE I START LOOSING MY SLEEP
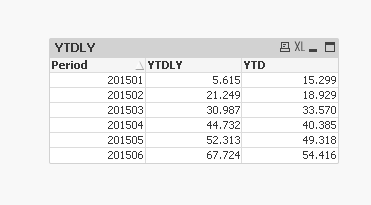
I attached a screenshot of what I dream of !
I Just upload a basic qvw
you will see I can't have for dimension 201505 both YTD 201405 sales and YTD 201505 (and then growth for instance)....
Accepted Solutions
- Mark as New
- Bookmark
- Subscribe
- Mute
- Subscribe to RSS Feed
- Permalink
- Report Inappropriate Content
Something along these lines?
YTDLY:
RangeSum(Above(Sum({$<PeriodID = {"<=$(=Max(PeriodID) - 12)"}, Year = {"$(=Max(Year) - 1)"}, Quarter = , Month = , Period = > } Sales), Count(DISTINCT TOTAL {$<PeriodID = {"<=$(=Max(PeriodID))"}, Year = {"$(=Max(Year))"}, Quarter = , Month = , Period = > } Period), RowNo()))
YTD:
RangeSum(Above(Sum({$<PeriodID = {"<=$(=Max(PeriodID))"}, Year = {"$(=Max(Year))"}, Quarter = , Month = , Period = > } Sales), 0, RowNo()))
- Mark as New
- Bookmark
- Subscribe
- Mute
- Subscribe to RSS Feed
- Permalink
- Report Inappropriate Content
Can you share the data with which we can help you show how this can be done?
- Mark as New
- Bookmark
- Subscribe
- Mute
- Subscribe to RSS Feed
- Permalink
- Report Inappropriate Content
Try this expression for YTDLY:
Above(Sum({$<PeriodID = {"<=$(=Max(PeriodID) - 12)"}, Year = {"$(=Max(Year) - 1)"}, Quarter = , Month = , Period = > } Sales), Count(DISTINCT TOTAL {$<PeriodID = {"<=$(=Max(PeriodID))"}, Year = {"$(=Max(Year))"}, Quarter = , Month = , Period = > } Period))
- Mark as New
- Bookmark
- Subscribe
- Mute
- Subscribe to RSS Feed
- Permalink
- Report Inappropriate Content
Dear Sunny, thanks very much this is rising hope.
it indeed display for a shared period label '201503' the 2015 and 2014 at month level.
could you adapt your script to have YTD (jan to march) ?
is the above function work when data are ranked ? or just always considering the periodID value.
AGAIN MANY THANKS
- Mark as New
- Bookmark
- Subscribe
- Mute
- Subscribe to RSS Feed
- Permalink
- Report Inappropriate Content
Something along these lines?
YTDLY:
RangeSum(Above(Sum({$<PeriodID = {"<=$(=Max(PeriodID) - 12)"}, Year = {"$(=Max(Year) - 1)"}, Quarter = , Month = , Period = > } Sales), Count(DISTINCT TOTAL {$<PeriodID = {"<=$(=Max(PeriodID))"}, Year = {"$(=Max(Year))"}, Quarter = , Month = , Period = > } Period), RowNo()))
YTD:
RangeSum(Above(Sum({$<PeriodID = {"<=$(=Max(PeriodID))"}, Year = {"$(=Max(Year))"}, Quarter = , Month = , Period = > } Sales), 0, RowNo()))
- Mark as New
- Bookmark
- Subscribe
- Mute
- Subscribe to RSS Feed
- Permalink
- Report Inappropriate Content
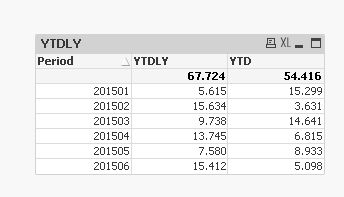
Sunny, you are excellent.
I will take time to analyse your WORKING code carefully.
I didn't expect to receive so relevant support so quicky !!!
thanks sunindia
- Mark as New
- Bookmark
- Subscribe
- Mute
- Subscribe to RSS Feed
- Permalink
- Report Inappropriate Content
No problem my friend 
I am glad I was able to help.
- Mark as New
- Bookmark
- Subscribe
- Mute
- Subscribe to RSS Feed
- Permalink
- Report Inappropriate Content
hi sunny,
I tried also to have both MAT (sum of the 12 last months data for the graphed period) and MAT same 12 months but with last year reference displayed for the same period dimension
-> having 201501, 201502, 201503 as dimension and ploted in line for 201501 actual MAT for 201501 but also mat 201401 for the sames dimension 201501 etc ...
I did managed to have the expression for MAT but not for MAT last year.
can you be kind enough to share your though on that ?
- Mark as New
- Bookmark
- Subscribe
- Mute
- Subscribe to RSS Feed
- Permalink
- Report Inappropriate Content
Sorry I was quite confusing.
basically what I would like is to have an MAT version of the YTD measurement per period with still this concept of having MAT and MAT last year....
- Mark as New
- Bookmark
- Subscribe
- Mute
- Subscribe to RSS Feed
- Permalink
- Report Inappropriate Content
I will check it out for you