Unlock a world of possibilities! Login now and discover the exclusive benefits awaiting you.
- Qlik Community
- :
- Forums
- :
- Analytics
- :
- App Development
- :
- Re: Using multiple variables in ValueList that are...
- Subscribe to RSS Feed
- Mark Topic as New
- Mark Topic as Read
- Float this Topic for Current User
- Bookmark
- Subscribe
- Mute
- Printer Friendly Page
- Mark as New
- Bookmark
- Subscribe
- Mute
- Subscribe to RSS Feed
- Permalink
- Report Inappropriate Content
Using multiple variables in ValueList that are AGG() functions
Hello everyone. I'm trying to get a pie chart built in Qlik Sense but I'm having some issues. I've got 2 variables
$(vTest1)
Sum(Aggr(
Only({<scheduleTypeId={7}>} scheduleValue) * Only({<metricId={101}>} hourlyValue)
,masterCalendarDate,locationId))
$(vTest2)
Sum(Aggr(
(Only({<metricId={1}>} hourlyValue) - Only({<scheduleTypeId={7}>} scheduleValue)) * Only({<metricId={102}>} hourlyValue)
,masterCalendarDate,locationId))
And I want to put both of their values into a pie chart. I have the following expression as my Dimension:
ValueList('Test1','Test2')
and my Measure:
if(ValueList('Test1','Test2')='Test1',$(vTest1), $(vTest2))
With the following tables, I'm only seeing the value for Test1 show up in my pie chart
| locationId | masterCalendarDate | metricId | hourlyValue |
|---|---|---|---|
| 43 | 12/31/2015 19:00 | 1 | 10 |
| 43 | 12/31/2015 19:00 | 101 | 1 |
| 43 | 12/31/2015 19:00 | 102 | 9 |
| 43 | 12/31/2015 19:00 | 876 | 8 |
| locationId | masterCalendarDate | scheduleId | scheduleValue |
|---|---|---|---|
| 43 | 12/31/2015 19:00 | 7 | 5 |
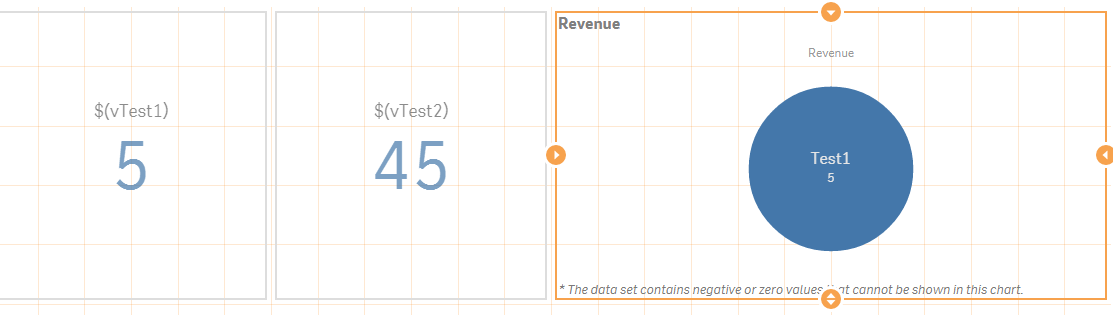
What I'm seeing is that if I put $(vTest1) and $(vTest2) into KPI I get the correct values (5 and 45). But I'm only seeing $(vTest1) in my pie chart. Here is a SS of my sheet. I'm not sure why the Pie Chart says I have negative or zero values since I can see that both are positive values. Any help or advice you've got is greatly appreciated. Thanks!
- « Previous Replies
-
- 1
- 2
- Next Replies »
- Mark as New
- Bookmark
- Subscribe
- Mute
- Subscribe to RSS Feed
- Permalink
- Report Inappropriate Content
Stephan, to simplify your search - look up "The Third Law of AGGR" in my book. It explains how AGGR doesn't perform very well when the AGGR() dimensions are not more detailed than the Chart dimensions.
This issue is really hard to wrap your mind around... A DISTINCT AGGR will produce a single value for each combination of its dimensions. This chart requires two values, but we only have one single value coming back from AGGR(). In order to produce two values, one of the following needs to happen:
1. Either the AGGR needs to include the chart dimension, and for that the chart dimension needs to be a Field, not a calculated formula. This would be an implementation of "The Third Law of AGGR()".
2. Or, if possible, the AGGR can be made NODISTINCT, and then it will return multiple values for each combination of the dimensional values, but in many cases the aggregate results will be incorrect.
cheers,
Oleg Troyansky
- Mark as New
- Bookmark
- Subscribe
- Mute
- Subscribe to RSS Feed
- Permalink
- Report Inappropriate Content
But what is confusing here is that if the above worked in a text box object why would it have difficult (and would need NODISTINCT) in a ValueList dimension. I would essentially think that it should behave the same way, no? What's different here?
- Mark as New
- Bookmark
- Subscribe
- Mute
- Subscribe to RSS Feed
- Permalink
- Report Inappropriate Content
Oleg, I think I've understood the grain mismatch issues in general (leading to headache from time to time when building the virtual cubes).
I am still reading the part in your book (p.500-547), though, quite a lot of stuff.
I am more asking myself why this happens also in this specific setting.
I think this has something to do with both expressions in each path of the if-statement being executed and evaluated all of the time (no short-circuiting), for both dimensional values, something I remember from a discussion with Henric and Rob:help - performance improvements
This would explain (to me), why the grain mismatch issue also happens with something like
=if(ValueList('Test1','Test2')='Test1','Constant', $(vTest2)) // no good
Sunny, there is a difference between evaluation in a text box and using a chart with dimensions, see Oleg's explanation and HIC's blog post I've mentioned above. The grain mismatch only appears if you have conflicting /mismatching chart dimensions vs. aggr() dimensions.
- Mark as New
- Bookmark
- Subscribe
- Mute
- Subscribe to RSS Feed
- Permalink
- Report Inappropriate Content
Stephan,
correct. The "grain mismatch", as HIC calls it, or the "Third Law of AGGR()", as I call it, happens disregarding of the IF() condition and the synthetic dimension.
What baffles most of us here is that logically, the expression appears to be fine. IF Test1, then give me the single value from this AGGR(), otherwise, give me the single value from the other AGGR(), - but QlikView engine doesn't seem to follow this logic. For QlikView, there is the expression (think of it as a black box) and two dimensional values. The fact that one AGGR() should be used for one dimensional value and the other AGGR() should be used for another dimensional value, is purely coincidental. No matter what, QlikView dispenses the single available result of all AGGR() functions to the first line, and that's it...
- Mark as New
- Bookmark
- Subscribe
- Mute
- Subscribe to RSS Feed
- Permalink
- Report Inappropriate Content
Thanks Oleg! You've confirmed my suspicions 
talk is cheap, supply exceeds demand
- « Previous Replies
-
- 1
- 2
- Next Replies »