Unlock a world of possibilities! Login now and discover the exclusive benefits awaiting you.
- Qlik Community
- :
- All Forums
- :
- QlikView App Dev
- :
- Re: How to do Forecasting?
- Subscribe to RSS Feed
- Mark Topic as New
- Mark Topic as Read
- Float this Topic for Current User
- Bookmark
- Subscribe
- Mute
- Printer Friendly Page
- Mark as New
- Bookmark
- Subscribe
- Mute
- Subscribe to RSS Feed
- Permalink
- Report Inappropriate Content
How to do Forecasting?
Hi Friends,
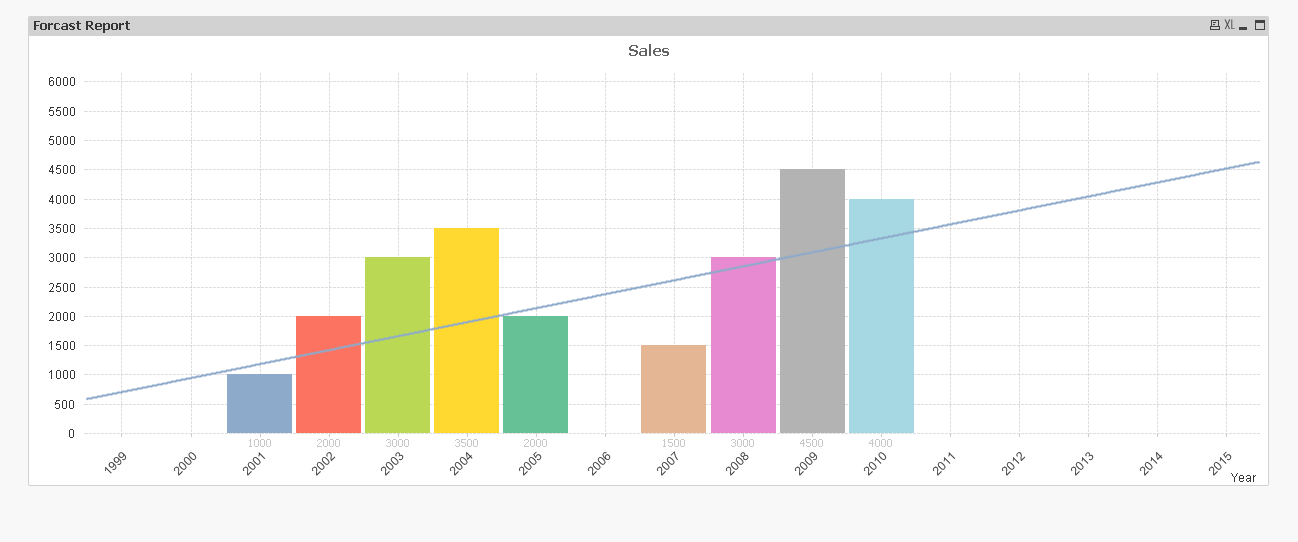
I've a data like as below
| Year | Sales |
| 2001 | 1000 |
| 2002 | 2000 |
| 2003 | 3000 |
| 2004 | 3500 |
| 2005 | 2000 |
| 2007 | 1500 |
| 2008 | 3000 |
| 2009 | 4500 |
| 2010 | 4000 |
I need to show the Sales value in line chart up to 2012 by forecasting Can you please help me how to do this..
- Mark as New
- Bookmark
- Subscribe
- Mute
- Subscribe to RSS Feed
- Permalink
- Report Inappropriate Content
We don't have a complete dynamic forcasting method in Qlikview but if you go the Axis tab you have the option like Forcast you can use this option ....other than this you need to prepare the data and need to feed the same for Qlikview.
- Mark as New
- Bookmark
- Subscribe
- Mute
- Subscribe to RSS Feed
- Permalink
- Report Inappropriate Content
See the attachment, Forcasting using What If in QV
- Mark as New
- Bookmark
- Subscribe
- Mute
- Subscribe to RSS Feed
- Permalink
- Report Inappropriate Content
I already used that expression but I didn't get can you please share me any step by step docs if u ve means..
- Mark as New
- Bookmark
- Subscribe
- Mute
- Subscribe to RSS Feed
- Permalink
- Report Inappropriate Content
ji I can't open that file till now am using personal edition only.
so can you please tell me how to do in step by step..
- Mark as New
- Bookmark
- Subscribe
- Mute
- Subscribe to RSS Feed
- Permalink
- Report Inappropriate Content
Hi,
You can do ForeCast according Your data,
If You require another Five years,Fore cast means,
Under Axes Tab ->At Forecast use an integer 5 -> Dimension Axes as Continuous
Under Expression Tab ->Select your Expression -> Trendlines -> There you can select as per your requirement ->
- Average
- Linear
- Polynomial
- Exponential
Similarly for BackCast too.
Hope this helps,
PFA,
Hirish
“Aspire to Inspire before we Expire!”