Unlock a world of possibilities! Login now and discover the exclusive benefits awaiting you.
- Qlik Community
- :
- Forums
- :
- Analytics
- :
- App Development
- :
- Re: Map question
- Subscribe to RSS Feed
- Mark Topic as New
- Mark Topic as Read
- Float this Topic for Current User
- Bookmark
- Subscribe
- Mute
- Printer Friendly Page
- Mark as New
- Bookmark
- Subscribe
- Mute
- Subscribe to RSS Feed
- Permalink
- Report Inappropriate Content
Map question
Hello everyone,
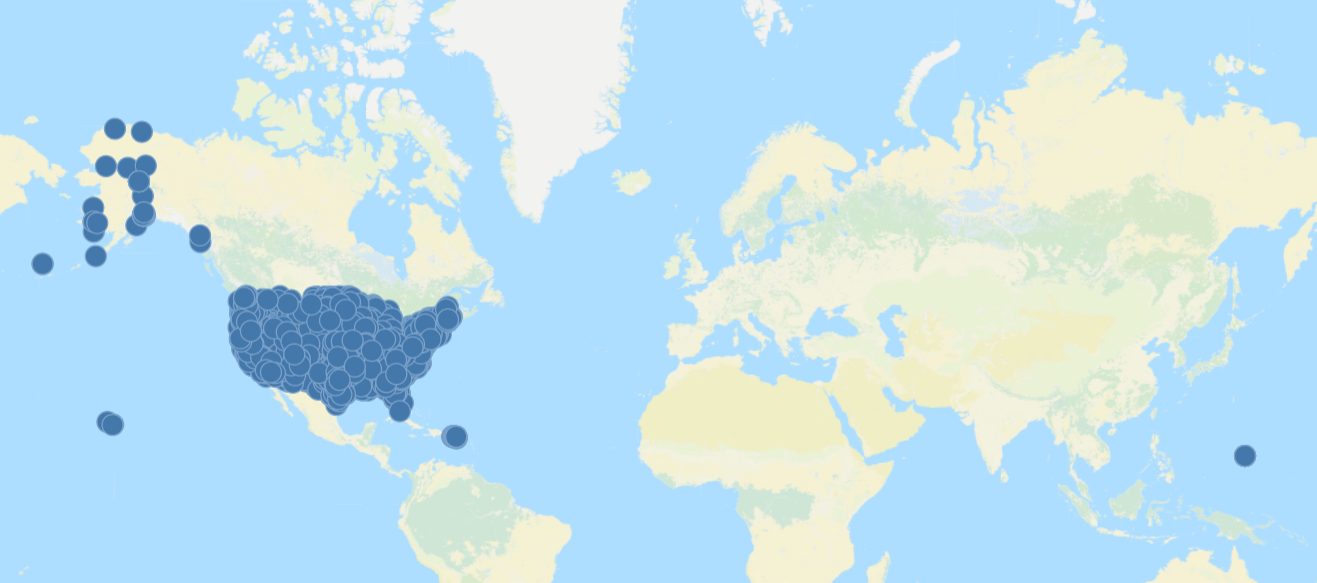
I'm working on a demo project where one of the things I want to show is the amazing ability to easily show a map 😃 I downloaded dummy data with lots of cities (along with their longitude and latitude) for the map. I finally have my map now, but I can't show the bubbles in different sizes since it's dummy data non-connected to anything that has to do with sales. It looks like this right now:
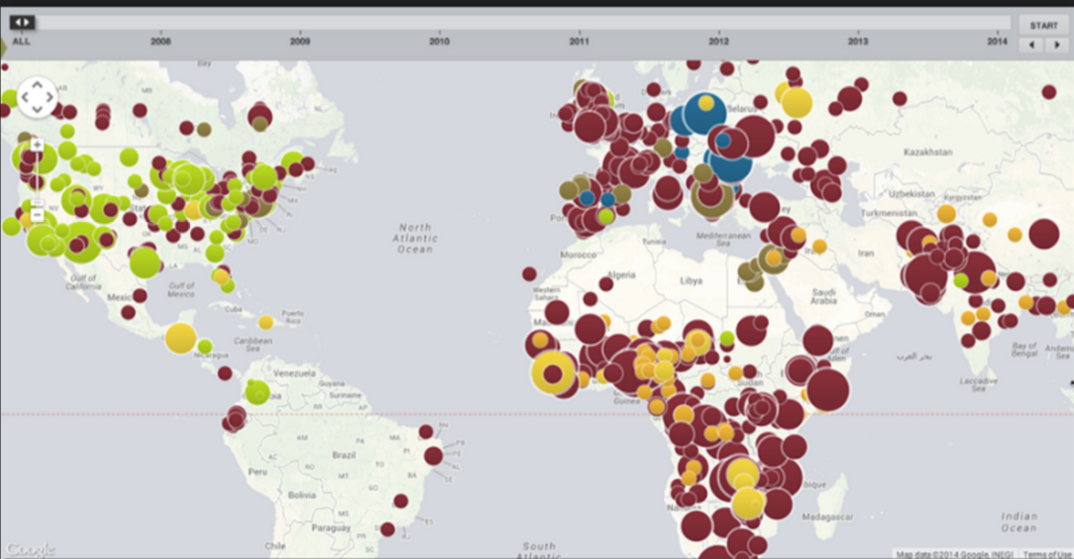
However, I want it to look like this (some bubbles bigger and some smaller):
Does anyone have a trick to make this happen even if it's not connected to sales or anything else?
Sincerely,
Betty Habtemariam
- Tags:
- map visualisation
Accepted Solutions
- Mark as New
- Bookmark
- Subscribe
- Mute
- Subscribe to RSS Feed
- Permalink
- Report Inappropriate Content
Hi Betty,
all you need is ANY calculation that returns variable numeric results. Even the rand() function could work - just play with the min/max bubble sizes.
Cheers,
Oleg Troyansky
Upgrade your Qlik skills at the Masters Summit for Qlik - coming soon to Milan, Italy!
- Mark as New
- Bookmark
- Subscribe
- Mute
- Subscribe to RSS Feed
- Permalink
- Report Inappropriate Content
Hi Betty,
You can simply use your Latitudes and Longitudes as measures in Expression like
Sum(Latitude+Longitude)
OR
Sum(Latitude)
OR
Sum(Longitude)
and Tick the 'Use Expression for Bubble Size' option.
Adjust the bubble size according to your convenience.
Regards,
Rohan
- Mark as New
- Bookmark
- Subscribe
- Mute
- Subscribe to RSS Feed
- Permalink
- Report Inappropriate Content
Thank you! It worked! 😃