Unlock a world of possibilities! Login now and discover the exclusive benefits awaiting you.
Announcements
Live today at 11 AM ET. Get your questions about Qlik Connect answered, or just listen in.
SIGN UP NOW
- Qlik Community
- :
- All Forums
- :
- QlikView App Dev
- :
- Re: Create a chart as show below
Options
- Subscribe to RSS Feed
- Mark Topic as New
- Mark Topic as Read
- Float this Topic for Current User
- Bookmark
- Subscribe
- Mute
- Printer Friendly Page
Turn on suggestions
Auto-suggest helps you quickly narrow down your search results by suggesting possible matches as you type.
Showing results for
Not applicable
2016-02-03
03:02 AM
- Mark as New
- Bookmark
- Subscribe
- Mute
- Subscribe to RSS Feed
- Permalink
- Report Inappropriate Content
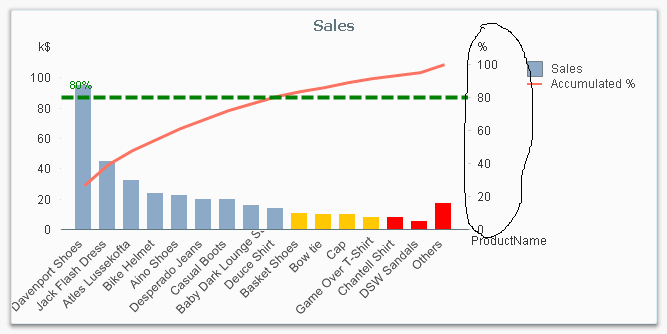
Create a chart as show below
hi want to show % in my graph as shown below
204 Views
1 Solution
Accepted Solutions
Not applicable
2016-02-03
01:56 PM
Author
- Mark as New
- Bookmark
- Subscribe
- Mute
- Subscribe to RSS Feed
- Permalink
- Report Inappropriate Content
Goto Presentation tab on the chart properties and Select Right Y-Axis for Acculturated %
1 Reply
Not applicable
2016-02-03
01:56 PM
Author
- Mark as New
- Bookmark
- Subscribe
- Mute
- Subscribe to RSS Feed
- Permalink
- Report Inappropriate Content
Goto Presentation tab on the chart properties and Select Right Y-Axis for Acculturated %