Unlock a world of possibilities! Login now and discover the exclusive benefits awaiting you.
- Qlik Community
- :
- All Forums
- :
- Connectivity & Data Prep
- :
- Linest_M and Linest_B ?
- Subscribe to RSS Feed
- Mark Topic as New
- Mark Topic as Read
- Float this Topic for Current User
- Bookmark
- Subscribe
- Mute
- Printer Friendly Page
- Mark as New
- Bookmark
- Subscribe
- Mute
- Subscribe to RSS Feed
- Permalink
- Report Inappropriate Content
Linest_M and Linest_B ?
Hi all,
Could anyone please explain me how linest_m and linest_b works in script and chart when my dimension(X) is date column and measure(Y) is Price, which are grouped materials.
example:
Load * Inline [
Material, InvoiceDate, Price,
A,01/01/2015,60
A,01/02/2015,30
A,01/03/2015,40
B,01/01/2015,12
B,01/01/2015,18
B,01/01/2015,10
B,01/01/2015,16
]
delimiter is ',';
My main doubt is How Linest work when we have Date column as dimension?
When given given some numeric valued column as dimension, it's working fine.
Many thanks
Regards
Prashanth
- Mark as New
- Bookmark
- Subscribe
- Mute
- Subscribe to RSS Feed
- Permalink
- Report Inappropriate Content
As you mentioned, X and Y values need to be numeric, so read your dates in as numbers:
Then, you need to decide what you want to do with multiple price values per date and material as for material B in your sample. I've decided to average these values.
If you want to match the linest_b value the value shown as trend line in the line chart, you need to correct the x-value by subtracting the min value.
Then your script could look like
Set DateFormat = 'MM/DD/YYYY';


INPUT:
Load * Inline [
Material, InvoiceDate, Price,
A,01/01/2015,60
A,01/02/2015,30
A,01/03/2015,40
B,01/01/2015,12
B,01/01/2015,18
B,01/01/2015,10
B,01/01/2015,16
];


LEFT JOIN
LOAD Material, Min(InvoiceDate) as MinDate Resident INPUT GROUP BY Material;


LOAD LINEST_M( AvgPrice, InvoiceDate) as M, LINEST_B(AvgPrice, InvoiceDate-MinDate) as B, Material
GROUP BY Material;
LOAD Material, InvoiceDate, Only(MinDate) as MinDate, Avg(Price) as AvgPrice
Resident INPUT
GROUP BY Material, InvoiceDate;
Which will only give a M / B values for material A, since you only have one X value for material B.
Compare the values for trend line in chart, see attached sample.
- Mark as New
- Bookmark
- Subscribe
- Mute
- Subscribe to RSS Feed
- Permalink
- Report Inappropriate Content
Thanks for the reply Sweuhl.
I am trying to figure it out in Sense.
To get the trend line in combo chart, how would I use the Linest .
Is it, M and B from script or do I need to use Linest in chart again??
If that is the case, will the values from script and chart matches?
- Mark as New
- Bookmark
- Subscribe
- Mute
- Subscribe to RSS Feed
- Permalink
- Report Inappropriate Content
You would only calculate this in the script when the result shouldn't change when you make selections.
In general, calculation of linest_m and linest_b should not differ between QS and QV, here is an example in QS:
How to add lineal trend in Qlik sense
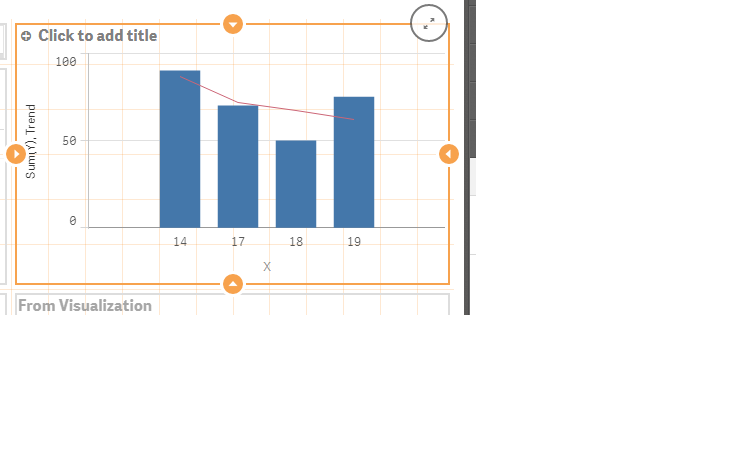
Note that the example chosen by Michael is not the best possible, the dates on the axis are not sequential, so the linear trend doesn't look linear.
- Mark as New
- Bookmark
- Subscribe
- Mute
- Subscribe to RSS Feed
- Permalink
- Report Inappropriate Content
Hi Swuehl,
IWhat you said is true. It's working for the sample data.
But, when I apply the same to my original data It's not working. I have dates in dimension column.
Could you please explain how Linest_M and Linest_B exactly works??
- Mark as New
- Bookmark
- Subscribe
- Mute
- Subscribe to RSS Feed
- Permalink
- Report Inappropriate Content
If I have gaps in date column, how to fill that gaps as empties but not with zeros.
If I use the same column, I'm not able to get the straight line.
How can I achieve this?
- Mark as New
- Bookmark
- Subscribe
- Mute
- Subscribe to RSS Feed
- Permalink
- Report Inappropriate Content
Hi Swuehl, I have tried create the same thing but my data has gaps, as pasted below. The values a get are different to the ones in the graph; is it possible to achieve the same slope and intercept when you have gaps?
- A,01/01/2015,60
- A,01/02/2015,30
- A,01/03/2015,40
- A,01/07/2015,50
- A,01/15/2015,60
Many thanks,
Stu.