Unlock a world of possibilities! Login now and discover the exclusive benefits awaiting you.
- Qlik Community
- :
- Forums
- :
- Analytics
- :
- New to Qlik Analytics
- :
- Re: How to Calculate the In-service% vs Out-of-ser...
- Subscribe to RSS Feed
- Mark Topic as New
- Mark Topic as Read
- Float this Topic for Current User
- Bookmark
- Subscribe
- Mute
- Printer Friendly Page
- Mark as New
- Bookmark
- Subscribe
- Mute
- Subscribe to RSS Feed
- Permalink
- Report Inappropriate Content
How to Calculate the In-service% vs Out-of-service% of an equipment in an year, using bar chart?
Hi,
I have an employee's Work Calendar,
example
| Equipment# | Service Start Date | Service End Date |
|---|---|---|
| 00001 | 29/01/15 | 30/05/15 |
| 00001 | 24/07/15 | 29/11/15 |
| 00001 | 02/05/14 | 12/10/14 |
Now, Want to create a bar chat(similar to below image) for In-Service% Vs Out-Of-service% across the year 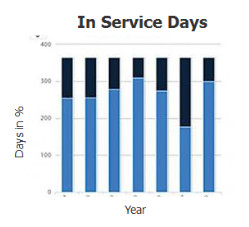
Kindly help on this
- Mark as New
- Bookmark
- Subscribe
- Mute
- Subscribe to RSS Feed
- Permalink
- Report Inappropriate Content
I think you will need to create the missing data and link them per intervalmatch to a master-calendar:
Generating Missing Data In QlikView
How to use - Master-Calendar and Date-Values
- Marcus
- Mark as New
- Bookmark
- Subscribe
- Mute
- Subscribe to RSS Feed
- Permalink
- Report Inappropriate Content
Hi
May be this
% Start :
count("Service Start Date") / ( count("Service Start Date") + count("Service End Date") )
% End
count("Service End Date") / ( count("Service Start Date") + count("Service End Date") )
in your graph :
Dimension YEARS
MESURES :
% Start
% End
select stacked option in graph panel
Hope it helps