Unlock a world of possibilities! Login now and discover the exclusive benefits awaiting you.
- Qlik Community
- :
- Forums
- :
- Analytics
- :
- New to Qlik Analytics
- :
- Re: How can I turn a table from horizontal to vert...
- Subscribe to RSS Feed
- Mark Topic as New
- Mark Topic as Read
- Float this Topic for Current User
- Bookmark
- Subscribe
- Mute
- Printer Friendly Page
- Mark as New
- Bookmark
- Subscribe
- Mute
- Subscribe to RSS Feed
- Permalink
- Report Inappropriate Content
How can I turn a table from horizontal to vertical
I have data by month.
I want to see the months across the top (columns) and the rest of the data in rows. By default I am getting the opposite and I don't see how to change that in Qlik Sense.
- Mark as New
- Bookmark
- Subscribe
- Mute
- Subscribe to RSS Feed
- Permalink
- Report Inappropriate Content
can you share your the sample .qvf ?
- Mark as New
- Bookmark
- Subscribe
- Mute
- Subscribe to RSS Feed
- Permalink
- Report Inappropriate Content
Make Use Of Pivot Table
And put in your Dimension as Rows and Measures As Column.
You Might get Desired Output
Regards,
- Mark as New
- Bookmark
- Subscribe
- Mute
- Subscribe to RSS Feed
- Permalink
- Report Inappropriate Content
Hi,
Its not possible in qlik sense using straight table, whereas you can do it via pivot table..
You can use a pivot table and move the rows to columns and vice versa
Regards,
Saniya 
- Mark as New
- Bookmark
- Subscribe
- Mute
- Subscribe to RSS Feed
- Permalink
- Report Inappropriate Content
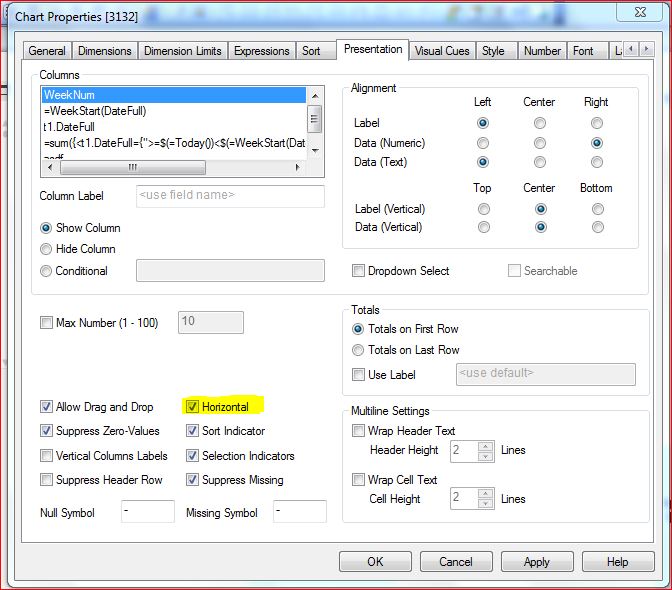
Not sure the below option available in QlikSense. In Qlikview Straight Table -> Horizontal option in Presentation tab..
- Mark as New
- Bookmark
- Subscribe
- Mute
- Subscribe to RSS Feed
- Permalink
- Report Inappropriate Content
You can easily do this in Qlik Sense with only one line of extra code in your load statement:
filters(Rotate(right)) 10th line in the load script below:


- Mark as New
- Bookmark
- Subscribe
- Mute
- Subscribe to RSS Feed
- Permalink
- Report Inappropriate Content
Notice that this is a Qlik Sense forum not a QlikView forum....
- Mark as New
- Bookmark
- Subscribe
- Mute
- Subscribe to RSS Feed
- Permalink
- Report Inappropriate Content
To do this do I need to use a CSV instead of an XLSX format?
Also, where is the default location that Qlik Sense desktop is looking for data file?
I tried to convert my xlsx file to csv and left in the same folder on my desktop. But the code you used says invalid path.
I tried (lib://Dashboard Data/HRMETRICS.csv). This works with the xlsx file.
- Mark as New
- Bookmark
- Subscribe
- Mute
- Subscribe to RSS Feed
- Permalink
- Report Inappropriate Content
The filters (...) thing also works with XLSX-files
- Mark as New
- Bookmark
- Subscribe
- Mute
- Subscribe to RSS Feed
- Permalink
- Report Inappropriate Content
Good morning a query as I can have two bar graphs 1st graph showing the cumulative current year to the selected month and the 2nd graph to show only selected month information example:
I have selected 2015 and May I want the first chart shows the information accumulated from January to May 2015
and the second graph shows the information only in May.
- Mark as New
- Bookmark
- Subscribe
- Mute
- Subscribe to RSS Feed
- Permalink
- Report Inappropriate Content
This is the code I am trying to get to work. When I load this I get an error that [Open} can not be found. I am not quite sure what I am doing wrong here. HRPERIOD is the Dimension that I want on the top. I want all of the others displayed on the left.
[Sheet1]:
LOAD [Period] AS [HRPeriod],
[Open],
[AvgTime],
[Hires],
[AvgCost],
[Contract_Labor],
[PT],
[OT],
[ST],
[PTA],
[OTA],
[HRSORT],
[Directors],
[Over 60],
[Over 6 Mos],
[Avg Days],
[PT$],
[OT$],
[ST$],
[PTA$],
[OTA$]
FROM [lib://Dashboard Data/HRMETRICS.xlsx]
(ooxml, embedded labels, table is Sheet1, filters(Rotate(right)
);