Unlock a world of possibilities! Login now and discover the exclusive benefits awaiting you.
- Qlik Community
- :
- All Forums
- :
- QlikView App Dev
- :
- how to set the min and max values of a guage chart...
- Subscribe to RSS Feed
- Mark Topic as New
- Mark Topic as Read
- Float this Topic for Current User
- Bookmark
- Subscribe
- Mute
- Printer Friendly Page
- Mark as New
- Bookmark
- Subscribe
- Mute
- Subscribe to RSS Feed
- Permalink
- Report Inappropriate Content
how to set the min and max values of a guage chart in percentages
Namste,
can anyone please help me on the following issue
I want to create a guage chart, with 3 segments , which shows the efficiency
100% to 99%
99% to 98%
98% to 97%
i am getting the error: Bad min or max value in guage
Thanks in advance
- Tags:
- qlikview_scripting
- Mark as New
- Bookmark
- Subscribe
- Mute
- Subscribe to RSS Feed
- Permalink
- Report Inappropriate Content
Hi Ganesh, you have to put the percentages like this (1, 0.98 and 0.97) Maybe you're putting those with coma instead of period?
Hope it helps,
Andrés
- Mark as New
- Bookmark
- Subscribe
- Mute
- Subscribe to RSS Feed
- Permalink
- Report Inappropriate Content
some improvement to my question,
here i have set the values in grange from
97% to 98%
98% to 99%
99% to 100%
but i want the needle to start from max value to min value since it is a efficiency guage.
I hope , i explained my question properly
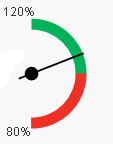
please see the uploaded guage in screenshot,
i want the needle to start from higher percentage that 100 to 99 to down ,as it is eeficiency
@Andres Prado
- Mark as New
- Bookmark
- Subscribe
- Mute
- Subscribe to RSS Feed
- Permalink
- Report Inappropriate Content
Hi Ganesh,
Are you sure that the values for efficiency are within the range of 0% and 100%?
When I am generating this error it is as a result of the values not being within that range or if my min value is greater than my max value.
For Gauge settings, you'll want:
Min: 0.97
Max: 1
I suggest checking the calculation in a straight table to see what the answers are, and moving from there.
Hope that helps
Paul
- Mark as New
- Bookmark
- Subscribe
- Mute
- Subscribe to RSS Feed
- Permalink
- Report Inappropriate Content
Hi Andres
thanks for the reply
at the moment, my guage chart is showing needle in clockwise direction from min to low 97% to 100%
I want needle of guage chart in anti clockwise direction i.e from 100 % to 97%
- Mark as New
- Bookmark
- Subscribe
- Mute
- Subscribe to RSS Feed
- Permalink
- Report Inappropriate Content
Hi Paul,
yes, i have taken the percentage of efficiency i want is from 97% to 100% as shown above in screenshot.
I want the needle to be moving in anti-clockwise direction or
i want to know, is there any way to get the guage chart values from 100% to 97%
i mean, 100 in place of 97 and vice versa in the above image.
i hope, i explained my problem
Thanks in advance
- Mark as New
- Bookmark
- Subscribe
- Mute
- Subscribe to RSS Feed
- Permalink
- Report Inappropriate Content
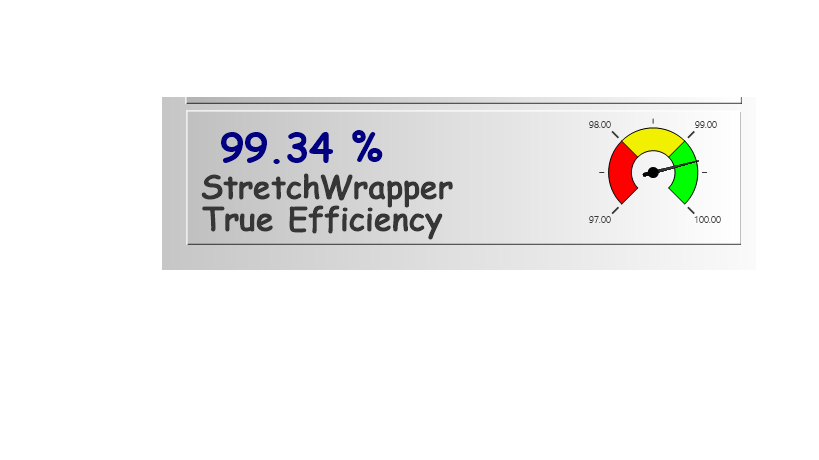
You cannot do this directly, so you have to work around the limitation. First negate the expression so that an increase is a decrease in your original expression:
=1 - <your current expression>
Make the chart from 0.97 - 1.0 but turn off the chart legend as it will display the negated value. On the presentation tab, Click Add for the Text in Chart option and add a 1.00 and 0.97 which you can re-position by holding down Shift+Control and dragging to the correct location for the axes scale. Or overlay with text objects to label the gauge.
This an example from a working model: