Unlock a world of possibilities! Login now and discover the exclusive benefits awaiting you.
- Qlik Community
- :
- All Forums
- :
- QlikView App Dev
- :
- Re: Line style/formatting in charts
- Subscribe to RSS Feed
- Mark Topic as New
- Mark Topic as Read
- Float this Topic for Current User
- Bookmark
- Subscribe
- Mute
- Printer Friendly Page
- Mark as New
- Bookmark
- Subscribe
- Mute
- Subscribe to RSS Feed
- Permalink
- Report Inappropriate Content
Line style/formatting in charts
I saw this post yesterday and asked the following question in that thread but no one saw it...
Can anyone tell me where I might find more of these expression values? For instance;
'<S1>' = Solid Line
'<S2>' = Dashed Line
'<S3>' = Etc....
What about line widths..? '<W1>' ? What other options are there? '<R1>'? '<T5>'? '<D3>'? '<K2>'? Anything else....? A comprehensive list would be great!
Thank you.
- « Previous Replies
-
- 1
- 2
- Next Replies »
- Mark as New
- Bookmark
- Subscribe
- Mute
- Subscribe to RSS Feed
- Permalink
- Report Inappropriate Content
This is great. I didn't see any documentation for controlling Line Symbols (Square, Dot, etc) in the expression. Is it possible ?
Thanks
- Mark as New
- Bookmark
- Subscribe
- Mute
- Subscribe to RSS Feed
- Permalink
- Report Inappropriate Content
Hello All,
Is there any way, where we can represent bar charts in following fashion ?
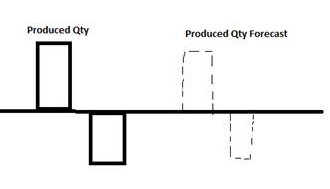
Thanks in advance
Regards
Kiran Shinde
- Mark as New
- Bookmark
- Subscribe
- Mute
- Subscribe to RSS Feed
- Permalink
- Report Inappropriate Content
Hi Kiran,
You can use '-(<Expression>)' (negative sign in front of second expression) and you can get a chart the way you asked for.
- Mark as New
- Bookmark
- Subscribe
- Mute
- Subscribe to RSS Feed
- Permalink
- Report Inappropriate Content
How does one make the linear line on a graph dashed?
- Mark as New
- Bookmark
- Subscribe
- Mute
- Subscribe to RSS Feed
- Permalink
- Report Inappropriate Content
Hi All,
I'm joining the discussion questions - is there any chance to get dashed line bar in bar chart?
Thank you for help!
Best Regards,
Jacek Antek
- Mark as New
- Bookmark
- Subscribe
- Mute
- Subscribe to RSS Feed
- Permalink
- Report Inappropriate Content
He needs dashed line borders - not negative bars.
- Mark as New
- Bookmark
- Subscribe
- Mute
- Subscribe to RSS Feed
- Permalink
- Report Inappropriate Content
Hi.
Although it doesnt look possible to have dashed line for bar charts, but you can use other trick.
Instead of changing line style, you can change background color to transparent!
E.g.:
If(Year < Year(Now()),
Color(RowNo()),
ARGB(128, Color(RowNo()) >>16 bitand 255, Color(RowNo()) >>8 bitand 255, Color(RowNo()) bitand 255 )
)
- « Previous Replies
-
- 1
- 2
- Next Replies »