Unlock a world of possibilities! Login now and discover the exclusive benefits awaiting you.
- Qlik Community
- :
- All Forums
- :
- QlikView App Dev
- :
- use month as static step for trend chart?
- Subscribe to RSS Feed
- Mark Topic as New
- Mark Topic as Read
- Float this Topic for Current User
- Bookmark
- Subscribe
- Mute
- Printer Friendly Page
- Mark as New
- Bookmark
- Subscribe
- Mute
- Subscribe to RSS Feed
- Permalink
- Report Inappropriate Content
use month as static step for trend chart?
Hi All,
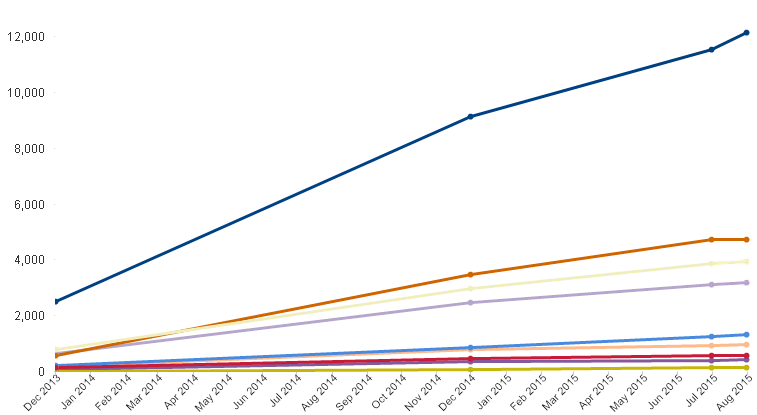
I have the chart below with the following Static Min and Static Max:
Static Min: MIN({1}EndDtMonYr)
Static Max: MAX(EndDtMonYr)
The below chart displays when I have the maximum EndDt (08/31/2015) selected.
When I select EndDt 12/31/2014, I see the following happen to the axes:
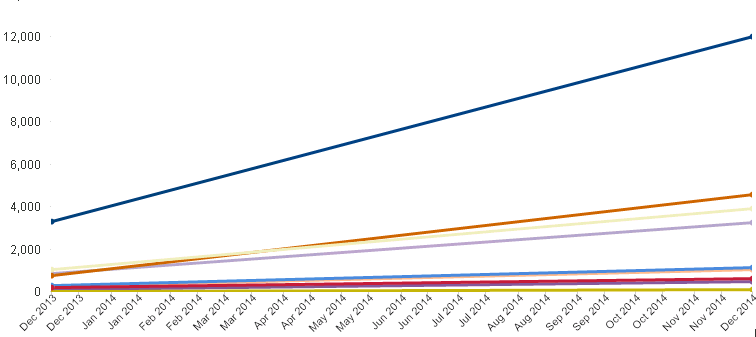
The months are listed twice...
How do I set the static step so that it only shows a month once? EndDt is always the last day of the month and EndDtMonYr is created using MonthName().
Thanks!
Tina
- Mark as New
- Bookmark
- Subscribe
- Mute
- Subscribe to RSS Feed
- Permalink
- Report Inappropriate Content
Hi,
Have you tried setting the time dimension as continuous (Axes tab)?
- Mark as New
- Bookmark
- Subscribe
- Mute
- Subscribe to RSS Feed
- Permalink
- Report Inappropriate Content
Yes, in order to set static min and static max for the scale, I needed to set the dimension axis as continuous. When I did not set this as continuous, the chart did not recognize the distance between months...
