Unlock a world of possibilities! Login now and discover the exclusive benefits awaiting you.
- Qlik Community
- :
- All Forums
- :
- QlikView App Dev
- :
- Re: KPI design
- Subscribe to RSS Feed
- Mark Topic as New
- Mark Topic as Read
- Float this Topic for Current User
- Bookmark
- Subscribe
- Mute
- Printer Friendly Page
- Mark as New
- Bookmark
- Subscribe
- Mute
- Subscribe to RSS Feed
- Permalink
- Report Inappropriate Content
KPI design
Hello All,
Please help me,how to put the values in the right place.what i mean is in attachment if u see
speedometer : Margin:18.37%
Testtube: 45% of targe
so how to get values in the same place as seen in the attachment for both style kpis ,i tried in
presentation --------->Text in chart
i am getting the value but how to put in the exact place as shown...please
please find the attachment
thanks
naveen
Accepted Solutions
- Mark as New
- Bookmark
- Subscribe
- Mute
- Subscribe to RSS Feed
- Permalink
- Report Inappropriate Content
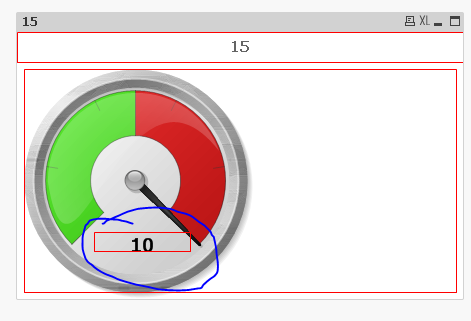
Have you tried pressing Ctrl + Shift and moving the text in chart to move to where ever you desire it to.
UPDATE: you will see something like this (red lines) when you press Ctrl + Shift. Move the box for text in chart
- Mark as New
- Bookmark
- Subscribe
- Mute
- Subscribe to RSS Feed
- Permalink
- Report Inappropriate Content
select the object move it
- Mark as New
- Bookmark
- Subscribe
- Mute
- Subscribe to RSS Feed
- Permalink
- Report Inappropriate Content
Have you tried pressing Ctrl + Shift and moving the text in chart to move to where ever you desire it to.
UPDATE: you will see something like this (red lines) when you press Ctrl + Shift. Move the box for text in chart
- Mark as New
- Bookmark
- Subscribe
- Mute
- Subscribe to RSS Feed
- Permalink
- Report Inappropriate Content
u cn select object and move there in layout layer as top.
- Mark as New
- Bookmark
- Subscribe
- Mute
- Subscribe to RSS Feed
- Permalink
- Report Inappropriate Content
to press the cltrl +shift and move the object
- Mark as New
- Bookmark
- Subscribe
- Mute
- Subscribe to RSS Feed
- Permalink
- Report Inappropriate Content
hi naveen,
To change the location of object y can use cltrl +shift and move
Or
you can use separate text box .