Unlock a world of possibilities! Login now and discover the exclusive benefits awaiting you.
- Qlik Community
- :
- Forums
- :
- Analytics
- :
- App Development
- :
- Re: Variables, pivot chart heat maps, if statement...
- Subscribe to RSS Feed
- Mark Topic as New
- Mark Topic as Read
- Float this Topic for Current User
- Bookmark
- Subscribe
- Mute
- Printer Friendly Page
- Mark as New
- Bookmark
- Subscribe
- Mute
- Subscribe to RSS Feed
- Permalink
- Report Inappropriate Content
Variables, pivot chart heat maps, if statements, and input boxes
Hi Everyone,
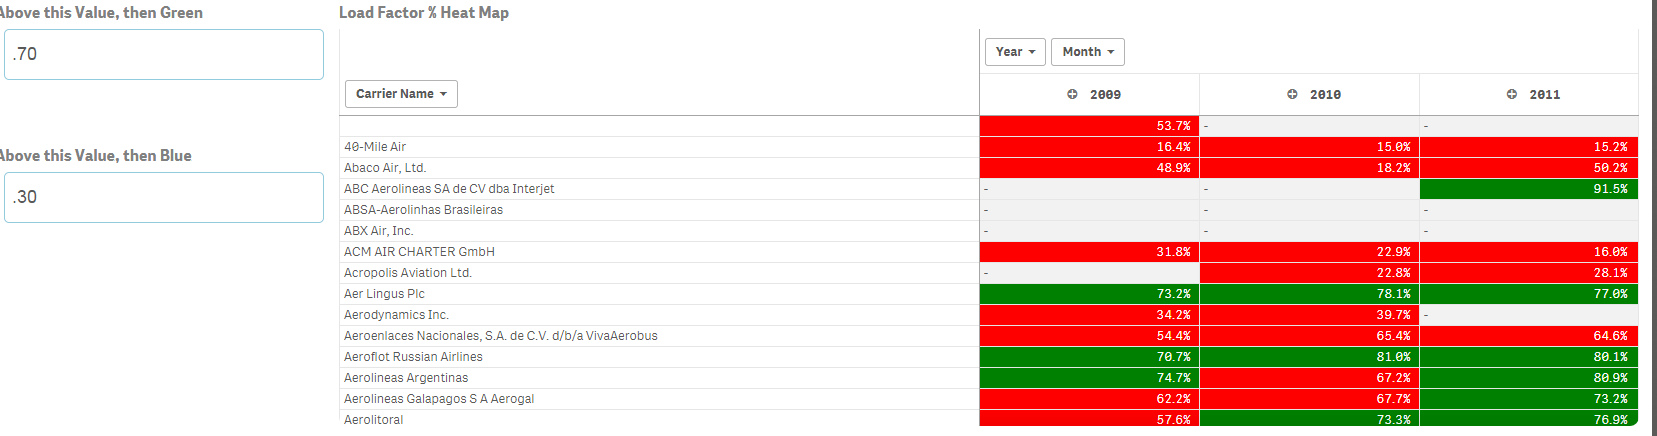
I am trying to make a pivot table with "heat map" of the values using the "background color expression".
I was able to successfully does this using the following if statement in the "background color expression":
If([Load Factor %] >= .85, Green(), If([Load Factor %] >= .70, LightBlue(), LightRed()))
Resulting in a chart like this:

However, you will note above that Green and Blue values are hard-coded at .85 and .70 respectively. I want to make an input box where the user can decided was values will make some green or blue. To attempt this I did the following:
- downloaded an input box from Branch
- Created two variables
- vGreat, and set initial value to .85
- vGood, and set initial value to .70
- Changed if statement to: If([Load Factor %] >= $(vGreat), Green(), If([Load Factor %] >= $(vGood), LightBlue(), LightRed()))
- Created two input box using branch extension
- set first input box to use variable "vGreat"
- set second input box to use variable "vGood"
But my heat map pivot table just doesnt seem to react correctly. It appears that the first input box works as expected, but then it appears whatever value I put in the second input box is just ignored. Any ideas?
I have attached the QVF I am working on, please refer to the "analysis tab". There you will see the heat map with hardcoded values, heat map attempt with variables, and the two input boxes.
Thanks!
Accepted Solutions
- Mark as New
- Bookmark
- Subscribe
- Mute
- Subscribe to RSS Feed
- Permalink
- Report Inappropriate Content
I'm sorry, but it works fine for me. Either with changing the values directly in the Variable Editor UI or with another variable extension qsVariable that I already had installed. But maybe I just don't understand why you would make the value of vGreat smaller than the value of vGood.
talk is cheap, supply exceeds demand
- Mark as New
- Bookmark
- Subscribe
- Mute
- Subscribe to RSS Feed
- Permalink
- Report Inappropriate Content
Can you post a smaller example? I'm not going to download 52 MB.
talk is cheap, supply exceeds demand
- Mark as New
- Bookmark
- Subscribe
- Mute
- Subscribe to RSS Feed
- Permalink
- Report Inappropriate Content
Done. Same data, just limited load to 10,000 records.
- Mark as New
- Bookmark
- Subscribe
- Mute
- Subscribe to RSS Feed
- Permalink
- Report Inappropriate Content
I'm sorry, but it works fine for me. Either with changing the values directly in the Variable Editor UI or with another variable extension qsVariable that I already had installed. But maybe I just don't understand why you would make the value of vGreat smaller than the value of vGood.
talk is cheap, supply exceeds demand
- Mark as New
- Bookmark
- Subscribe
- Mute
- Subscribe to RSS Feed
- Permalink
- Report Inappropriate Content
can you show me a screenshot where you input .90 (vGreat) in the first input box and .50 (vGood) in the second input box?
- Mark as New
- Bookmark
- Subscribe
- Mute
- Subscribe to RSS Feed
- Permalink
- Report Inappropriate Content
See attached image. I've added the same limits to the top pivot chart so they show the same colors.
talk is cheap, supply exceeds demand
- Mark as New
- Bookmark
- Subscribe
- Mute
- Subscribe to RSS Feed
- Permalink
- Report Inappropriate Content
So strange, I must be doing something incorrectly. Could to attach your qvf?
- Mark as New
- Bookmark
- Subscribe
- Mute
- Subscribe to RSS Feed
- Permalink
- Report Inappropriate Content
Sure. Here you go.
talk is cheap, supply exceeds demand
- Mark as New
- Bookmark
- Subscribe
- Mute
- Subscribe to RSS Feed
- Permalink
- Report Inappropriate Content
thanks! Much appreciated.