Unlock a world of possibilities! Login now and discover the exclusive benefits awaiting you.
- Qlik Community
- :
- All Forums
- :
- QlikView App Dev
- :
- Re: How to convert my chart rEVENUE Amt by month (...
- Subscribe to RSS Feed
- Mark Topic as New
- Mark Topic as Read
- Float this Topic for Current User
- Bookmark
- Subscribe
- Mute
- Printer Friendly Page
- Mark as New
- Bookmark
- Subscribe
- Mute
- Subscribe to RSS Feed
- Permalink
- Report Inappropriate Content
How to convert my chart rEVENUE Amt by month ( 1 Line chart ) to 2 line using only 1 expression for eask compare CY vs LY ?
Hi All
Chart 1 is good. Because only 1 expression & expression is very shot , it can plot 2 line. Expression as below :-
Sum(
{<Year={'>$(=year(today())-2)'}>}
sales)
Chart 2 is working fine too , but i like it present like chart 1 format. So that i can easily compare with LY trend. Chart 2 Expression as below :-
sum({<rEVENUE={"rEVENUE"}>}Amount)
My imagine of the final expression ( chart 3 )as below :-
Sum(
{<Year={'>$(=year(today())-2)'}>}
{<rEVENUE={"rEVENUE"}>}Amount
)
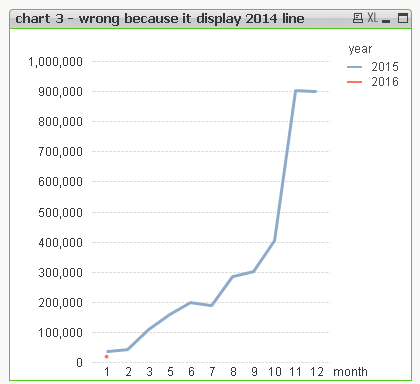
How to make chart 3 display format same as chart 1 ? by not display 2014 line ? ( Take note that Chart 1 only display 2015 and 2016 line )
Paul
- Tags:
- qlikview_scripting
Accepted Solutions
- Mark as New
- Bookmark
- Subscribe
- Mute
- Subscribe to RSS Feed
- Permalink
- Report Inappropriate Content
- Mark as New
- Bookmark
- Subscribe
- Mute
- Subscribe to RSS Feed
- Permalink
- Report Inappropriate Content
Are you looking for this?
- Mark as New
- Bookmark
- Subscribe
- Mute
- Subscribe to RSS Feed
- Permalink
- Report Inappropriate Content
Hi Sunny
Thank you finally my chart now look perfect.
Paul
- Mark as New
- Bookmark
- Subscribe
- Mute
- Subscribe to RSS Feed
- Permalink
- Report Inappropriate Content
Hi Sunny
Can you sharing with me , why after you remove the below , the chart look fine ?
,>}{<
Paul
- Mark as New
- Bookmark
- Subscribe
- Mute
- Subscribe to RSS Feed
- Permalink
- Report Inappropriate Content
Remove? What did I remove?
- Mark as New
- Bookmark
- Subscribe
- Mute
- Subscribe to RSS Feed
- Permalink
- Report Inappropriate Content
Hi Sunny
My Org imagine code not working :-
Sum(
{<Year={'>$(=year(today())-2)'}>}
{<rEVENUE={"rEVENUE"}>}Amount
)
why your code is working :-
Sum(
{<Year={'>$(=year(today())-2)'}, rEVENUE={'rEVENUE'}>}Amount
)
Because you remove below away , and it work.
,>}{<
I like to know why ?
Paul
- Mark as New
- Bookmark
- Subscribe
- Mute
- Subscribe to RSS Feed
- Permalink
- Report Inappropriate Content
Because the one you used was incorrect syntax for set analysis. Set Analysis conditions are separated by comma -> {<Field1 = {'SomeValue'}, Field2 = {'AnotherValue'}>}
- Mark as New
- Bookmark
- Subscribe
- Mute
- Subscribe to RSS Feed
- Permalink
- Report Inappropriate Content
Hi Sunny
Thank you very much for your explanation.
Paul