Unlock a world of possibilities! Login now and discover the exclusive benefits awaiting you.
- Qlik Community
- :
- All Forums
- :
- QlikView App Dev
- :
- Re: how to display quaters expression value in ba...
- Subscribe to RSS Feed
- Mark Topic as New
- Mark Topic as Read
- Float this Topic for Current User
- Bookmark
- Subscribe
- Mute
- Printer Friendly Page
- Mark as New
- Bookmark
- Subscribe
- Mute
- Subscribe to RSS Feed
- Permalink
- Report Inappropriate Content
how to display quaters expression value in bar chart
Hello All,
i am trying to convert my straight table into bar chart,the problem is......i cant able to display quarters expression value...how to display then as well?.....
dimension:LOCATION
expression1:current score
exp2(current quarter) :FirstSortedValue(QUARTER,-ADATE)
exp3: previous score
exp4(previous quarter):FirstSortedValue(QUARTER,-ADATE,2)
exp2 and exp4 are missing
please fins the attachment .......
- Mark as New
- Bookmark
- Subscribe
- Mute
- Subscribe to RSS Feed
- Permalink
- Report Inappropriate Content
Hi
shall i share my qvw file?
- Mark as New
- Bookmark
- Subscribe
- Mute
- Subscribe to RSS Feed
- Permalink
- Report Inappropriate Content
Hi,
Yes please.
Regards,
Kaushik Solanki
- Mark as New
- Bookmark
- Subscribe
- Mute
- Subscribe to RSS Feed
- Permalink
- Report Inappropriate Content
Hello.....
its on Sheet5............ after the coal sheet
- Mark as New
- Bookmark
- Subscribe
- Mute
- Subscribe to RSS Feed
- Permalink
- Report Inappropriate Content
Hello
please find the attached qvw file in the above reply
- Mark as New
- Bookmark
- Subscribe
- Mute
- Subscribe to RSS Feed
- Permalink
- Report Inappropriate Content
Hope this will solve your problem.
Regards,
Kaushik Solanki
- Mark as New
- Bookmark
- Subscribe
- Mute
- Subscribe to RSS Feed
- Permalink
- Report Inappropriate Content
This might be the other option available (or can be used in combination with Kaushik's solution):
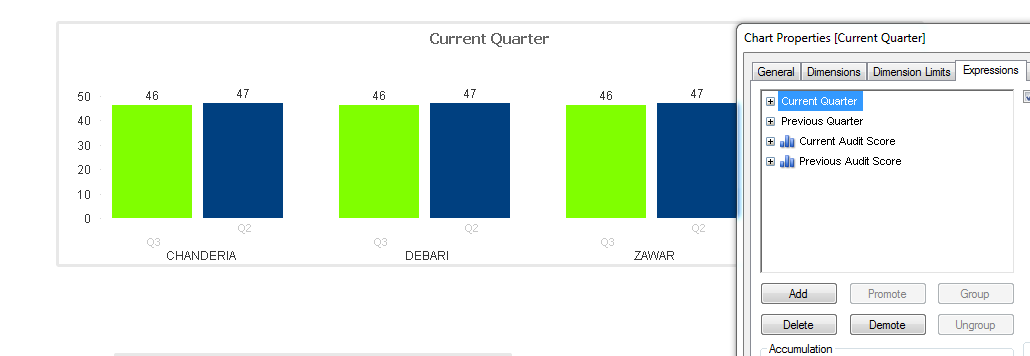
Axis on the bar shows Q3 and Q2.
- Mark as New
- Bookmark
- Subscribe
- Mute
- Subscribe to RSS Feed
- Permalink
- Report Inappropriate Content
Hello,
i cant able to open the qvw....will u please brief me what i need to do
- Mark as New
- Bookmark
- Subscribe
- Mute
- Subscribe to RSS Feed
- Permalink
- Report Inappropriate Content
Hi,
is this reply for me or some one else?
- Mark as New
- Bookmark
- Subscribe
- Mute
- Subscribe to RSS Feed
- Permalink
- Report Inappropriate Content
Opps Sorry Wrong paste..
Here is the what you are looking.
Use this as label for expression.
='Current Audit Score (' & Aggr(FirstSortedValue(QUARTER,-ADATE), LOCATION) &')'
='Previous Audit Score(' & Aggr(FirstSortedValue(QUARTER,-ADATE,2), LOCATION) &')'
Regards,
Kaushik Solanki
- Mark as New
- Bookmark
- Subscribe
- Mute
- Subscribe to RSS Feed
- Permalink
- Report Inappropriate Content
Hi
your bar chart look ok ,mine looks horrible .....how to achieve your one
please find the attachment