Unlock a world of possibilities! Login now and discover the exclusive benefits awaiting you.
- Qlik Community
- :
- All Forums
- :
- QlikView Administration
- :
- Re: Line Chart showing values separately
- Subscribe to RSS Feed
- Mark Topic as New
- Mark Topic as Read
- Float this Topic for Current User
- Bookmark
- Subscribe
- Mute
- Printer Friendly Page
- Mark as New
- Bookmark
- Subscribe
- Mute
- Subscribe to RSS Feed
- Permalink
- Report Inappropriate Content
Line Chart showing values separately
Hello,
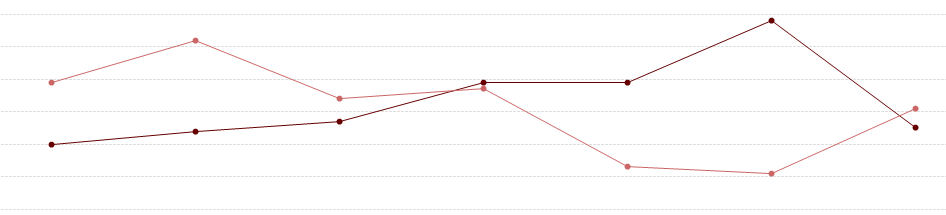
i created a line chart with an time dimension and 4 formulas.
COUNT({CompiGroup1}Text) --> visualization = line
COUNT({CompiGroup1}Text)-Above(COUNT({CompiGroup1}Text)) --> visualization = only values
COUNT({CompiGroup2}Text) --> visualization = line
COUNT({CompiGroup2}Text)-Above(COUNT({CompiGroup2}Text)) --> visualization = only values
It's showing the values for each alternate states in the same graph. my requirement is to have it separated.
Is there any grouping function? (one Group for each alternate state)
Thanks

- Tags:
- qlikview_deployment
- Mark as New
- Bookmark
- Subscribe
- Mute
- Subscribe to RSS Feed
- Permalink
- Report Inappropriate Content
Not sure I understand what you are looking for, do you have a sample you can share?
- Mark as New
- Bookmark
- Subscribe
- Mute
- Subscribe to RSS Feed
- Permalink
- Report Inappropriate Content
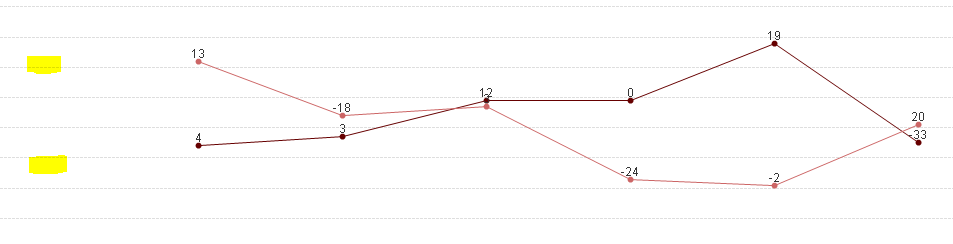
Try only two expressions:
Dual(COUNT({CompiGroup1}Text)-Above(COUNT({CompiGroup1}Text)), COUNT({CompiGroup1}Text) ) --> visualization = line and values on data points
Dual( COUNT({CompiGroup2}Text)-Above(COUNT({CompiGroup2}Text)), COUNT({CompiGroup2}Text)) --> visualization = line and values on data points
- Mark as New
- Bookmark
- Subscribe
- Mute
- Subscribe to RSS Feed
- Permalink
- Report Inappropriate Content
Hi,
thanks. good answer!
It's working fine, unless I'm missing the starts points for both graphs, any idea?
- Mark as New
- Bookmark
- Subscribe
- Mute
- Subscribe to RSS Feed
- Permalink
- Report Inappropriate Content
finally I got it. thanks
DUAL(IF(ISNULL(COUNT({CompiGroup1}Text)-Above(COUNT({CompiGroup1}Text))), '',COUNT({CompiGroup1}Text)-Above(COUNT({CompiGroup1}Text))),COUNT({CompiGroup1}Text))
- Mark as New
- Bookmark
- Subscribe
- Mute
- Subscribe to RSS Feed
- Permalink
- Report Inappropriate Content
Dual(COUNT({CompiGroup1}Text)-Above(COUNT({CompiGroup1}Text)), COUNT({CompiGroup1}Text) ) --> visualization = line and values on data points
Dual( COUNT({CompiGroup2}Text)-Above(COUNT({CompiGroup2}Text)), COUNT({CompiGroup2}Text)) --> visualization = line and values on data points