Unlock a world of possibilities! Login now and discover the exclusive benefits awaiting you.
- Qlik Community
- :
- Forums
- :
- Analytics
- :
- New to Qlik Analytics
- :
- Re: Combine variables
- Subscribe to RSS Feed
- Mark Topic as New
- Mark Topic as Read
- Float this Topic for Current User
- Bookmark
- Subscribe
- Mute
- Printer Friendly Page
- Mark as New
- Bookmark
- Subscribe
- Mute
- Subscribe to RSS Feed
- Permalink
- Report Inappropriate Content
Combine variables
Hello experts,
I am new to Qlik Sense and I am facing a challenge.
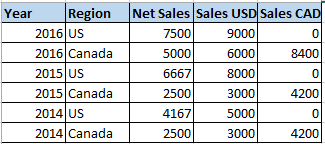
I need to create different visualizations using different charts, but on all of them having the capability to change its parameters, i.e., using different variables. I need to combine variables in a way that if Year 2015 is selected, it picks 2014 as Previous, other just use 2016 and 2015 as Previous Year.
Also, if Canada is selected, show Sales in CAD, otherwise show sales in USD. I still need to add another variable to switch between Net Sales and Gross Sales.
In short, I have 4 variables that I have to work with and there are 16 combinations. I would have to create a long IF THEN condition statements, prone to errors.
I read an article about creating Aggregation Fields and create variables based on the aggregation fields.
Could anyone advise what could be the best solution?
Than you in advance
Accepted Solutions
- Mark as New
- Bookmark
- Subscribe
- Mute
- Subscribe to RSS Feed
- Permalink
- Report Inappropriate Content
apologies - put it in a quick test and need some changes!
MAX won't work on text, so create an inline as:
LOAD * INLINE [
SalesNum,Sales
1,'Net'
2,'Gross'];
then two variables:
vSales: =IF([SalesNum],MAX([SalesNum]),2)
and
vSalesTotal: =IF(vSales=1,SUM([Net Sales]),SUM([Gross Sales]))
then your measure becomes:
$(vCurrency('CAD',vSalesTotal))
substituting 'CAD' for your Currency field
You can then create a FILTER pane with [Sales] as the Dimension - then when the user selects Net it changes to [Net Sales] otherwise its [Gross Sales]
- Mark as New
- Bookmark
- Subscribe
- Mute
- Subscribe to RSS Feed
- Permalink
- Report Inappropriate Content
Few questions:
1. What if two years are selected? Is your application restricting users from making multiple selections in the "Year" filter box?
2. Do you have a separate field for CAN$ sales? Or you are using a conversion rate to display Sales in different currency?
3. What do you mean by "switching between Net Sales and Gross Sales" ? Do you need to display different values in the same column? How these sales values are organized in your data model?
VK
- Mark as New
- Bookmark
- Subscribe
- Mute
- Subscribe to RSS Feed
- Permalink
- Report Inappropriate Content
Vlad,
1. We display our sales dashboard in periods of two years, and show the growth compared to previous year. So, for this solution the users will only be able to select one year at a time, and see two years of data at a time, Default year will be current year (2016) and last year, and if user selects 2015, then 2014 is last year's data.
2. Yes, Canada sales in CAD has its own field, the conversion happens in the data source, which then gets loaded into Qlik in CAD already.
3. Net Sales and Gross sales are different fields as well. Only one value, at this time, will be displayed. So users can choose between Net or Gross, but Gross is the default value. We could organized these two fields to be displayed side by side, but users want to see them individually.
Thanks,
LD
- Mark as New
- Bookmark
- Subscribe
- Mute
- Subscribe to RSS Feed
- Permalink
- Report Inappropriate Content
Another thread will help with the Currency: Dynamically changing number formats?
As far as Year & Previous Year - I normally use a MAX([YearField]) to return the selected year (takes care of multiple selections) and store the results into variables (previous year obviously being MAX([YearField])-1)
Net & Gross could be similar - put an IF statement into the displayed measure, base on a variable setting
e.g. SUM(IF(vSales = 'Net',[Net Sales],[Gross Sales]))
- Mark as New
- Bookmark
- Subscribe
- Mute
- Subscribe to RSS Feed
- Permalink
- Report Inappropriate Content
Andrew,
Those are great ideas and using the MAX year if the best option. How would you combine all these variables together?
For every chart and table, users have to be able to switch between cases and dollars, Years, Net sales and Gross sales, and US and Canada.
My biggest issue is finding the best way to apply all these variables together.
I also found this post below which gave me good ideas as well.
Thanks,
LD
- Mark as New
- Bookmark
- Subscribe
- Mute
- Subscribe to RSS Feed
- Permalink
- Report Inappropriate Content
morning,
Something like:
SET vCurrency = IF($1 = 'CAD',NUM($2,'£#,##0.00'),NUM($2,'$#,##0.00'));
then call it as:
=vCurrency('CAD',IF(vSales='Net',SUM([Net Sales]),SUM([Gross Sales])))
put:
LOAD * INLINE [
Sales
'Net'
'Gross'];
then create a variable called vSales as:
IF([Sales],MAX([Sales]),'Gross')
Haven't tested any of this by the way!
- Mark as New
- Bookmark
- Subscribe
- Mute
- Subscribe to RSS Feed
- Permalink
- Report Inappropriate Content
apologies - put it in a quick test and need some changes!
MAX won't work on text, so create an inline as:
LOAD * INLINE [
SalesNum,Sales
1,'Net'
2,'Gross'];
then two variables:
vSales: =IF([SalesNum],MAX([SalesNum]),2)
and
vSalesTotal: =IF(vSales=1,SUM([Net Sales]),SUM([Gross Sales]))
then your measure becomes:
$(vCurrency('CAD',vSalesTotal))
substituting 'CAD' for your Currency field
You can then create a FILTER pane with [Sales] as the Dimension - then when the user selects Net it changes to [Net Sales] otherwise its [Gross Sales]
- Mark as New
- Bookmark
- Subscribe
- Mute
- Subscribe to RSS Feed
- Permalink
- Report Inappropriate Content
Andrew,
Sorry for the late reply. I finally had time to put it in test and it worked for what I needed.
My biggest challenge is to learn how to properly work with variables.
Thanks again.