Unlock a world of possibilities! Login now and discover the exclusive benefits awaiting you.
- Qlik Community
- :
- Forums
- :
- Analytics
- :
- New to Qlik Analytics
- :
- Re: Color coding
- Subscribe to RSS Feed
- Mark Topic as New
- Mark Topic as Read
- Float this Topic for Current User
- Bookmark
- Subscribe
- Mute
- Printer Friendly Page
- Mark as New
- Bookmark
- Subscribe
- Mute
- Subscribe to RSS Feed
- Permalink
- Report Inappropriate Content
Color coding
Hi,
I am going through this qliksense app (Qlik Sense)and came across the treemap chart(Sheet- Regions).
Can someone explain this expression used for color coding:
ColorMix1 ((1+Sign(2*(num(Sum (MarginAmount)/Sum (SalesAmount),'#,##0.0%')-
RangeMin (top(total num(Sum (MarginAmount)/Sum (SalesAmount),'#,##0.0%'),1,NoOfRows(total))))/
(RangeMax (top(total num(Sum (MarginAmount)/Sum (SalesAmount),'#,##0.0%'),1,NoOfRows(total)))-
RangeMin (top(total num(Sum (MarginAmount)/Sum (SalesAmount),'#,##0.0%'),1,NoOfRows(total))))-1)*Sqrt(Fabs((2*(num(Sum (MarginAmount)/Sum (SalesAmount),'#,##0.0%')-
RangeMin (top(total num(Sum (MarginAmount)/Sum (SalesAmount),'#,##0.0%'),1,NoOfRows(total))))/(RangeMax (top(total num(Sum (MarginAmount)/Sum (SalesAmount),'#,##0.0%'),1,NoOfRows(total)))-
RangeMin (top(total num(Sum (MarginAmount)/Sum (SalesAmount),'#,##0.0%'),1,NoOfRows(total))))-1))))/2, ARGB(255, 178, 209, 178), ARGB(255, 0, 128, 0))
Thanks!
- Mark as New
- Bookmark
- Subscribe
- Mute
- Subscribe to RSS Feed
- Permalink
- Report Inappropriate Content
The colormix1 function returns a color value depending on its three arguments (from the HELP):
Colormix1() is used in expressions to return an ARGB color representation from a two color gradient, based on a value between 0 and 1.
Colormix1 (Value , ColorZero , ColorOne)
Value is a real number between 0 and 1.
- If Value = 0 ColorZero is returned.
- If Value = 1 ColorOne is returned.
- If 0 < Value< 1 the appropriate intermediate shading is returned.
So we need provide the ColorZero and ColorOne colors (look at the ARGB() functions) and a value as first argument that needs to be ranged 0 to 1. The chart shows profit margin% color coded, so we need to calculate profit margin for each dimension and somehow map the margin% into a range 0 to 1.
Lets's have a look at the function:
ColorMix1 (
(1+Sign(
2*(Sum (MarginAmount)/Sum (SalesAmount) - RangeMin (top(total Sum (MarginAmount)/Sum (SalesAmount),1,NoOfRows(total))))
/(RangeMax (top(total Sum (MarginAmount)/Sum (SalesAmount),1,NoOfRows(total)))-RangeMin (top(total Sum (MarginAmount)/Sum (SalesAmount),1,NoOfRows(total))))
-1)
*Sqrt(Fabs((
2*(Sum (MarginAmount)/Sum (SalesAmount)-RangeMin (top(total Sum (MarginAmount)/Sum (SalesAmount),1,NoOfRows(total))))
/(RangeMax (top(total (Sum (MarginAmount)/Sum (SalesAmount),1,NoOfRows(total)))-RangeMin (top(total Sum (MarginAmount)/Sum (SalesAmount),1,NoOfRows(total))))-1)
)))
/2
, ARGB(255, 178, 209, 178), ARGB(255, 0, 128, 0))
I've removed all num() functions and the format code, since we are only interested in the numbers, no formatting involved.
We identify Sum(Margin)/Sum(SalesAmount) as giving the profit margin%. Let's substitute with Margin% label:
ColorMix1 (
(1+Sign(
2*(Margin% - RangeMin (top(total Margin%,1,NoOfRows(total))))
/(RangeMax (top(total Margin%,1,NoOfRows(total)))-RangeMin (top(total Margin%,1,NoOfRows(total))))
-1)
*Sqrt(Fabs((
2*(Margin%-RangeMin (top(total Margin%,1,NoOfRows(total))))
/(RangeMax (top(total (Margin%,1,NoOfRows(total)))-RangeMin (top(total Margin%,1,NoOfRows(total))))-1)
)))
/2
, ARGB(255, 178, 209, 178), ARGB(255, 0, 128, 0))
RangeMin() / RangeMax() functions find the minimum/ maximum margin% in the chart (have a look in the help if you need to find out how they work).
ColorMix1 (
(1+
Sign(
2*(Margin% - Margin%_MIN)
/(Margin%_MAX-Margin%_MIN)
-1)
*Sqrt(Fabs((
2*(Margin%-Margin%_MIN)
/(Margin%_MAX-Margin%_MIN)
)))
/2
, ARGB(255, 178, 209, 178), ARGB(255, 0, 128, 0))
Margin%_MIN - Margin%_MAX can be labelled %Margin%_DELTA
ColorMix1 (
(1+
Sign(
2*(Margin% - Margin%_MIN)
/(Margin%_DELTA)
-1)
*Sqrt(Fabs((
2*(Margin%-Margin%_MIN)
/(Margin%_DELTA)
)))
/2
, ARGB(255, 178, 209, 178), ARGB(255, 0, 128, 0))
So it boils down to
(1 + Sign(2*(Margin% - Margin%_MIN)/(Margin%_DELTA)-1)
*Sqrt(Fabs((2*(Margin%-Margin%_MIN)/(Margin%_DELTA) )))
/2
Can you already tell that this maps the margin% to a value range 0 to 1?
Sign() will return 0, -1 or 1, fabs() returns the absolute value of 2*(Margin%-Margin%_MIN)/(Margin%_DELTA) hence a value between 0 and 2.
-->
(1 + [Either 0,-1 or 1]* Sqrt([0..2])) / 2
well... this doesn't seem to exactely map the margin% to a range between 0 and 1, maybe I messed it up in one of the above steps, or the creator of the expression messed it up. It should work ok if the expression would look like
(1 + [Either 0,-1 or 1]* ([0..1])) / 2
Just try yourself 
Regards,
Stefan
- Mark as New
- Bookmark
- Subscribe
- Mute
- Subscribe to RSS Feed
- Permalink
- Report Inappropriate Content
Thank you so much for the big explanation!! 
I tried this out in a chart(exact same expression,just the field name different).
In the 1st level it's working fine:
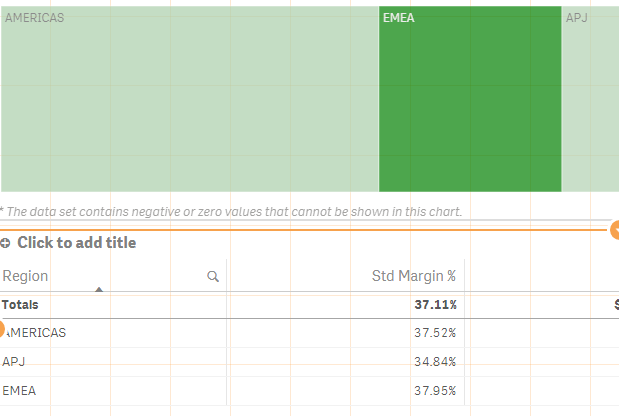
However, when I am drilling down further into APJ, it's not showing correctly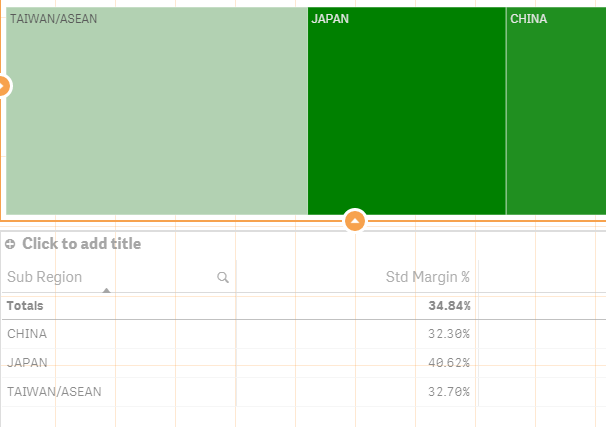
Do you know what is going wrong? Also is this the only way to color the chart by std margin %?
Can we do it in some other way?
- Mark as New
- Bookmark
- Subscribe
- Mute
- Subscribe to RSS Feed
- Permalink
- Report Inappropriate Content
Well, I don't have much more time to look into this in detail, maybe later this week.
In general, there are other functions in QV to map values to colors (like ColorMix2).
There are also other ways to map a value range A to B to another range C to D than the way shown above.
See for example
http://stackoverflow.com/questions/345187/math-mapping-numbers
From a technical point of view, you often need to find the extreme values in your chart (that's where the RangeMin() RangeMax() functions came into play above). It's easy to mess this up in Qlik, especially with different dimensions or drill down groups. So just try to debug your code by copying the relevant parts (like Margin%, Margin%_MIN and Margin%_Max to a table chart with the same dimensions, and check if these values make sense.
If they do, check your values range mapping. The color functions itself should work ok.
Have fun,
Stefan