Unlock a world of possibilities! Login now and discover the exclusive benefits awaiting you.
- Qlik Community
- :
- All Forums
- :
- QlikView Administration
- :
- Renaming values in dimension
- Subscribe to RSS Feed
- Mark Topic as New
- Mark Topic as Read
- Float this Topic for Current User
- Bookmark
- Subscribe
- Mute
- Printer Friendly Page
- Mark as New
- Bookmark
- Subscribe
- Mute
- Subscribe to RSS Feed
- Permalink
- Report Inappropriate Content
Renaming values in dimension
Hey guys! Long time user, first time poster.
So I work in clinical research and am developing a report. The events are recorded in a survey site we use [redcap], exported to excel and then uploaded to qlik. My problem is we were pretty over zealous in the answer choices to the survey. For instance the document calls each event "Pre - Op (Arm 1 : Phase 1) or "2 Week Post - Op (Arm 2 : Follow - Up)".
My problem is in my chart showing change over events, the titles of the events are so long I can't fit it all on my screen and it auto crops it out of view. Any help renaming specific answer choices? I would love to change the answer to "PreOp" or "2 Week".
There are only 4 different event names.
I was thinking it involves the AS command but I can't sort it out.
Thanks Qlik'ers
z
Accepted Solutions
- Mark as New
- Bookmark
- Subscribe
- Mute
- Subscribe to RSS Feed
- Permalink
- Report Inappropriate Content
Hi Zackary,
you need to change "Event Original Name" in the text below to what you have called your event field (the dimension name you use to create the graph). Then you can use an inline load to create a map if there are only a few field values you want to change.
Event Map:
LOAD * INLINE [
Event Original Name, Event New Name
Pre - Op (Arm 1 : Phase 1), PreOp
2 Week Post - Op (Arm 2 : Follow - Up), 2Week
];
or just create a table in excel like this:
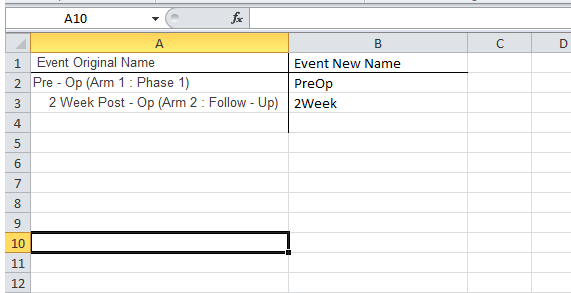
and use this script at the end:
Event Map:
LOAD [Event Original Name], // RENAME THIS TO YOUR FIELD NAME. I assume this is called "Event Name"?
[Event New Name]
FROM
(ooxml, embedded labels, table is Sheet1);
This will create an associative join on the [Event Original Name] field and give you a [Event New Name] value every time there is a match in the field [Event Original Name].
Thanks
Jonathan
- Mark as New
- Bookmark
- Subscribe
- Mute
- Subscribe to RSS Feed
- Permalink
- Report Inappropriate Content
Hi Zachery,
I think i would create a mapping table like this:
Event Map:
LOAD * INLINE [
Event Original Name, Event New Name
Pre - Op (Arm 1 : Phase 1), PreOp
2 Week Post - Op (Arm 2 : Follow - Up), 2Week
];
with [Event Original Name] being whatever you called the event field and then use [Event New Name] as the field in the chart.
Would that work in this case?
cheers
Jonathan
- Mark as New
- Bookmark
- Subscribe
- Mute
- Subscribe to RSS Feed
- Permalink
- Report Inappropriate Content
Thats for the Reply Jonathan! Would I put this code directly into the edit script after the event name?
Tacking it onto the end of the code and a separate command lead to errors 
Ive tried it out and isn't mapping tables used to rename whole columns? I just need to rename some fields within the column.
z
- Mark as New
- Bookmark
- Subscribe
- Mute
- Subscribe to RSS Feed
- Permalink
- Report Inappropriate Content
Hi Zackary,
you need to change "Event Original Name" in the text below to what you have called your event field (the dimension name you use to create the graph). Then you can use an inline load to create a map if there are only a few field values you want to change.
Event Map:
LOAD * INLINE [
Event Original Name, Event New Name
Pre - Op (Arm 1 : Phase 1), PreOp
2 Week Post - Op (Arm 2 : Follow - Up), 2Week
];
or just create a table in excel like this:
and use this script at the end:
Event Map:
LOAD [Event Original Name], // RENAME THIS TO YOUR FIELD NAME. I assume this is called "Event Name"?
[Event New Name]
FROM
(ooxml, embedded labels, table is Sheet1);
This will create an associative join on the [Event Original Name] field and give you a [Event New Name] value every time there is a match in the field [Event Original Name].
Thanks
Jonathan
- Mark as New
- Bookmark
- Subscribe
- Mute
- Subscribe to RSS Feed
- Permalink
- Report Inappropriate Content
You're the Guru of Qlikview! Thank you!!
z