Unlock a world of possibilities! Login now and discover the exclusive benefits awaiting you.
- Qlik Community
- :
- Forums
- :
- Analytics
- :
- New to Qlik Analytics
- :
- Re: how to avoid null values in table and chart
- Subscribe to RSS Feed
- Mark Topic as New
- Mark Topic as Read
- Float this Topic for Current User
- Bookmark
- Subscribe
- Mute
- Printer Friendly Page
- Mark as New
- Bookmark
- Subscribe
- Mute
- Subscribe to RSS Feed
- Permalink
- Report Inappropriate Content
how to avoid null values in table and chart
hi,
i am trying to do cyclic group in qlik sense. but the result giving null values. same thing i used in qlikview it works prefectly.
can any one take a look. i attached the sample here
thanks
- « Previous Replies
-
- 1
- 2
- Next Replies »
- Mark as New
- Bookmark
- Subscribe
- Mute
- Subscribe to RSS Feed
- Permalink
- Report Inappropriate Content
I'm not sure what we're meant to be looking at here - I can't see any nulls in the column of values (but I can see numbers and a 'zero' there as well).
What would I have to select to see nulls? Maybe you can send a screenshot with some highlighted errors?
- Mark as New
- Bookmark
- Subscribe
- Mute
- Subscribe to RSS Feed
- Permalink
- Report Inappropriate Content
the expression is written for to show to 10 values. it works perfectly in qlikview. but in qlik sense it bringing nulls. i dont get any error
- Mark as New
- Bookmark
- Subscribe
- Mute
- Subscribe to RSS Feed
- Permalink
- Report Inappropriate Content
for example Year value is not showing like 2014 and 2015. it showing both year together...
- Mark as New
- Bookmark
- Subscribe
- Mute
- Subscribe to RSS Feed
- Permalink
- Report Inappropriate Content
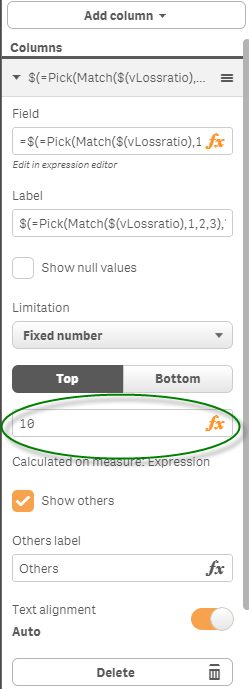
A-ha, I see the problem now (one of the columns was hidden due to the length of the title, so I missed it).
If you always want to show the top 10, you can do it with the limitation on the column;
- Mark as New
- Bookmark
- Subscribe
- Mute
- Subscribe to RSS Feed
- Permalink
- Report Inappropriate Content
top 10 is not based on the dimension it based on other filed. so i am doing this through expression using Rank function
- Mark as New
- Bookmark
- Subscribe
- Mute
- Subscribe to RSS Feed
- Permalink
- Report Inappropriate Content
Yes, but you're showing the Top 10 of the dimension according to the chosen measure.
E.g. "Top 10 cities by Population" - you choose the "Top 10 cities" and then choose the column called "Population".
It will automatically select the first column of measures - I'm not sure if that behaviour is changeable.
- « Previous Replies
-
- 1
- 2
- Next Replies »