Unlock a world of possibilities! Login now and discover the exclusive benefits awaiting you.
- Qlik Community
- :
- All Forums
- :
- QlikView App Dev
- :
- Re: Chart with unique values on Dimension
- Subscribe to RSS Feed
- Mark Topic as New
- Mark Topic as Read
- Float this Topic for Current User
- Bookmark
- Subscribe
- Mute
- Printer Friendly Page
- Mark as New
- Bookmark
- Subscribe
- Mute
- Subscribe to RSS Feed
- Permalink
- Report Inappropriate Content
Chart with unique values on Dimension
Hello,
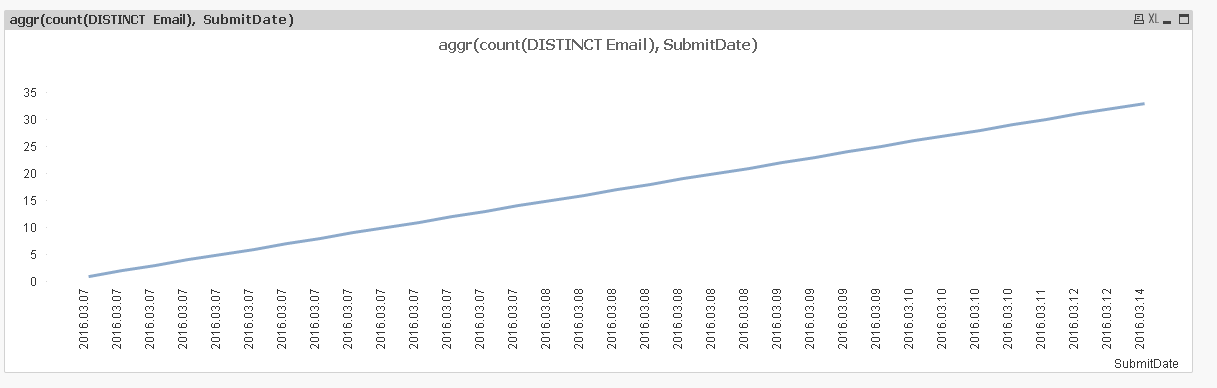
I have a line chart with Date as dimension and count Email address as expression.
The problem is that the chart shows all dates, instead of aggregating per date.
How can I show only unique values as dimension?
- « Previous Replies
-
- 1
- 2
- Next Replies »
- Mark as New
- Bookmark
- Subscribe
- Mute
- Subscribe to RSS Feed
- Permalink
- Report Inappropriate Content
The DayName() and DayStart() functions also remove / zero the time decimals.
But I still prefer using the Floor() function as it is far easier to see what is happening in the script from a quick eyeball.
- Mark as New
- Bookmark
- Subscribe
- Mute
- Subscribe to RSS Feed
- Permalink
- Report Inappropriate Content
Add a new field in your script:
Load *,
Date(MakeDate(Year(SubmitDate),Month(SubmitDate),Day(SubmitDate)),'DD/MM/YYYY') as SubmitDateNew
From Table
Use this new field in your chart dimention.
Expression: Count(Distinct Email)
- Mark as New
- Bookmark
- Subscribe
- Mute
- Subscribe to RSS Feed
- Permalink
- Report Inappropriate Content
Hi Sunny T. This solution fixed the problem. Thanks a lot and have a nice day.
- « Previous Replies
-
- 1
- 2
- Next Replies »