Unlock a world of possibilities! Login now and discover the exclusive benefits awaiting you.
- Qlik Community
- :
- Forums
- :
- Analytics
- :
- New to Qlik Analytics
- :
- Re: sheet navigation via charts
- Subscribe to RSS Feed
- Mark Topic as New
- Mark Topic as Read
- Float this Topic for Current User
- Bookmark
- Subscribe
- Mute
- Printer Friendly Page
- Mark as New
- Bookmark
- Subscribe
- Mute
- Subscribe to RSS Feed
- Permalink
- Report Inappropriate Content
sheet navigation via charts
Hi community,
my question: is there a way to navigate from a start page(sheet) to a another sheet by clicking on a chart.
So u have maybe 6 charts on start sheet and want to navigate to different sheets with deeper informations.
I thought there is maybe a way with Kpi or buttons to overlay them over a chart and give them a link function, but I dont found a way.
Thx in advance
- « Previous Replies
-
- 1
- 2
- Next Replies »
Accepted Solutions
- Mark as New
- Bookmark
- Subscribe
- Mute
- Subscribe to RSS Feed
- Permalink
- Report Inappropriate Content
You can try create a Mashup, and put on the qvobject in a div with a click or mouseover (js) response to open the chart... (another qvobject)
- Mark as New
- Bookmark
- Subscribe
- Mute
- Subscribe to RSS Feed
- Permalink
- Report Inappropriate Content
An easy way would be to layer a text box on top (make it transparent) and add an action to the text box to navigate to the sheet. So the user can't see the text box and when they click on the chart area they are taken to the relevant sheet.
I hope that helps
Thanks
Jonathan
- Mark as New
- Bookmark
- Subscribe
- Mute
- Subscribe to RSS Feed
- Permalink
- Report Inappropriate Content
Hi,
yes thats what i thought but, i dont know how to overlay the textbox.
- Mark as New
- Bookmark
- Subscribe
- Mute
- Subscribe to RSS Feed
- Permalink
- Report Inappropriate Content
Hi Eric,
I don't think it is possible to overlay a KPI object over any chart in the current version of QlikSense 2.2
You can place the 'KPI' object or 'Text & Image' object either above or below the chart and link them to the sheets.
Regards,
Rohan
- Mark as New
- Bookmark
- Subscribe
- Mute
- Subscribe to RSS Feed
- Permalink
- Report Inappropriate Content
Hi Rohan,
yeah thought about it and then make the kpi or textobject transparent.
That would be the solution.
but how to but objects above eachother.
thanks in advance
- Mark as New
- Bookmark
- Subscribe
- Mute
- Subscribe to RSS Feed
- Permalink
- Report Inappropriate Content
Sorry Eric, didn't read the post properly. No you can't layer objects in QlikSense.
- Mark as New
- Bookmark
- Subscribe
- Mute
- Subscribe to RSS Feed
- Permalink
- Report Inappropriate Content
Hi Eric,
Is it fine if user clicks on the title of the chart, it should navigate to another chart.
Something like this
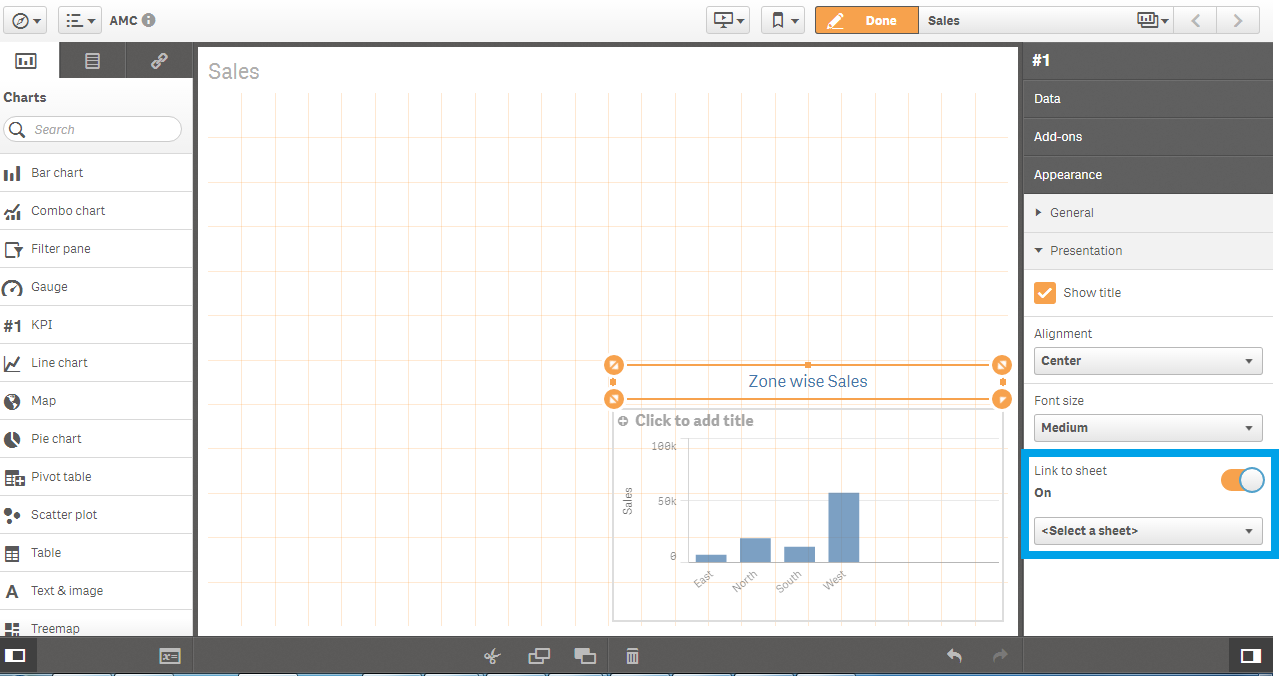
Don't give any title for the chart. Just place a KPI object above it.
In the 'Add Measures' of the KPI Data tab, write the name of the chart (In this case '=Zone wise Sales')
So 'Zone wise Sales' will actually appear as the title of the chart.
Use the 'Link to Sheet' option to select destination sheet.
Clicking on the title will take you to another sheet.
Hope this helps.
Regards,
Rohan
- Mark as New
- Bookmark
- Subscribe
- Mute
- Subscribe to RSS Feed
- Permalink
- Report Inappropriate Content
Thx for ur answer,
thats what i use atm.But thats not the way i want it, because its not very user friendly.Because most users are like "oh why is that number red "and click on it and nothing happens. u know.
- Mark as New
- Bookmark
- Subscribe
- Mute
- Subscribe to RSS Feed
- Permalink
- Report Inappropriate Content
You can try create a Mashup, and put on the qvobject in a div with a click or mouseover (js) response to open the chart... (another qvobject)
- Mark as New
- Bookmark
- Subscribe
- Mute
- Subscribe to RSS Feed
- Permalink
- Report Inappropriate Content
Hi Eric,
If you needed it in a dashboard, you can still achieve it using extension objects.
Thanks,
Sangram.
- « Previous Replies
-
- 1
- 2
- Next Replies »