Unlock a world of possibilities! Login now and discover the exclusive benefits awaiting you.
- Qlik Community
- :
- All Forums
- :
- QlikView App Dev
- :
- Re: Gantt chart query
- Subscribe to RSS Feed
- Mark Topic as New
- Mark Topic as Read
- Float this Topic for Current User
- Bookmark
- Subscribe
- Mute
- Printer Friendly Page
- Mark as New
- Bookmark
- Subscribe
- Mute
- Subscribe to RSS Feed
- Permalink
- Report Inappropriate Content
Gantt chart query
Hi guys
I need help
I'm making this gantt chart via 'recipe of gantt chart', but its pretty messed up. I've these tables;
- Project Names
- Project Codes
- Start Date
- End Date
- Milestones
It involves;
-Requirement Phase
-Blueprints
-Functional Requirement Done
-Business requirement Blah Blah
- Milestone dates
- Project Status
[whether it has been gone live, or dropped or Deployed]
- Calender
So this is what I'm getting now
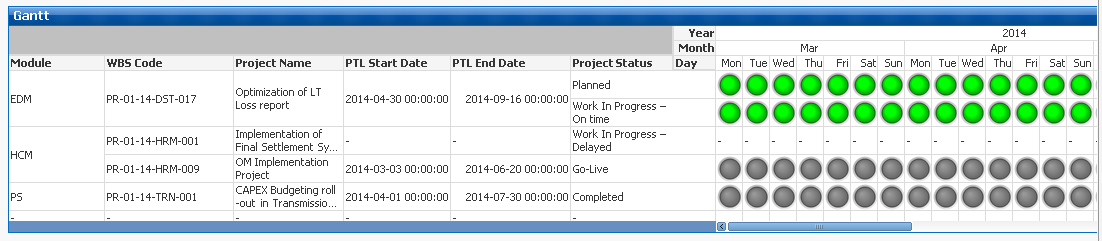
Though its a half screenshot. the expression i used was; max(End Date)-Min(Start Date) and i know this should not be not be the expression but the funniest part is i cant come up with a new expression.
All i want is something like that
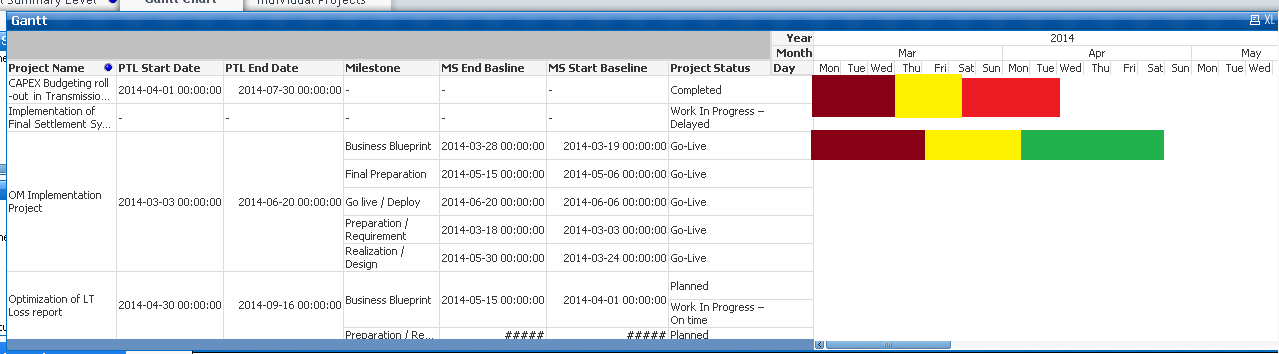
The brown color representing that its first milestone has been completed yellow represents the second one, and the red represents the fourth milestone and if it gets go live then it gets all green. This all would be changing colors as per dates. idk how to achieve that but i want to achieve it.
Regards
- Mark as New
- Bookmark
- Subscribe
- Mute
- Subscribe to RSS Feed
- Permalink
- Report Inappropriate Content