Unlock a world of possibilities! Login now and discover the exclusive benefits awaiting you.
- Qlik Community
- :
- Forums
- :
- Analytics
- :
- New to Qlik Analytics
- :
- How can I create a map with area layer in Qlik Sen...
- Subscribe to RSS Feed
- Mark Topic as New
- Mark Topic as Read
- Float this Topic for Current User
- Bookmark
- Subscribe
- Mute
- Printer Friendly Page
- Mark as New
- Bookmark
- Subscribe
- Mute
- Subscribe to RSS Feed
- Permalink
- Report Inappropriate Content
How can I create a map with area layer in Qlik Sense
Hello,
I am quite new with Qlik Sense and would like to create a map using an area layer.
In my load script, I have the following lines:
Sales:
Load *,
GeoMakePoint(LAT,LONG) as GeoPoint;
Load * inline
[
ID, SaleDate, SalePrice, SalePoint, LAT, LONG
1001, 10/1/2016, 200, NCE, 43.7, 2.25
1002, 10/01/2016, 200, PAR, 14.7, 23.10
1003, 10/01/2016, 200, LON, 28.7, 8.25
1004, 10/01/2016, 200, MAD, 39.7, 13.25
1005, 09/02/2016, 100, LON, 28.7, 8.25
1006, 09/02/2016, 100, PAR, 14.7, 23.10
1007, 11/02/2016, 300, NYC, 43.9, 56.25
];
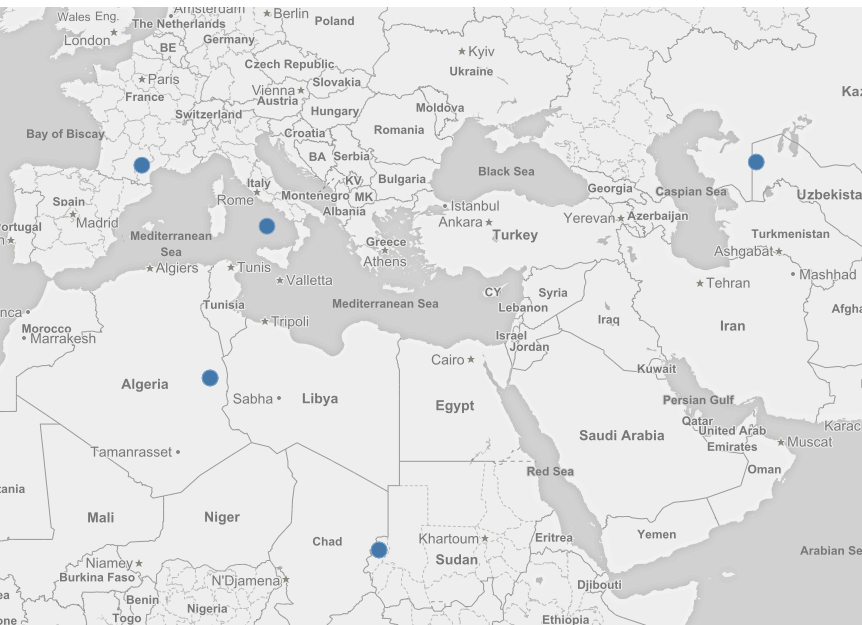
When I create the map it only allows Point Layer, i.e. this type of display with bubbles:
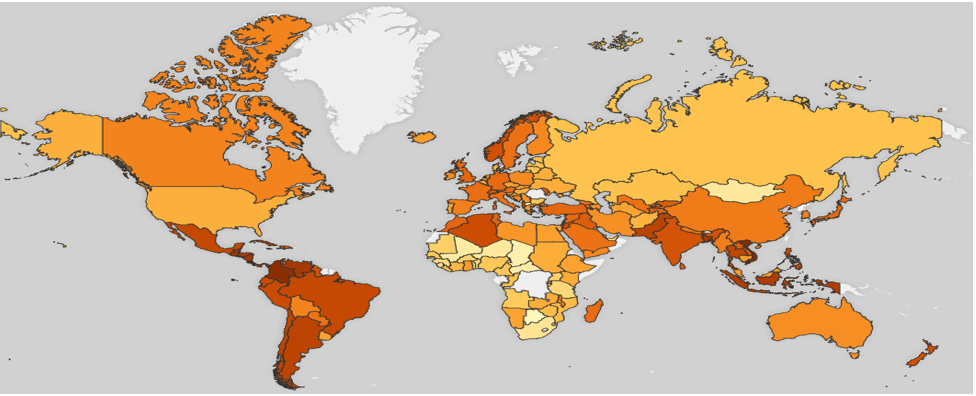
Instead, I would like to have this type of visualization (i.e with colors per area):
Many thanks in advance for your help.
Annick
- Tags:
- map
Accepted Solutions
- Mark as New
- Bookmark
- Subscribe
- Mute
- Subscribe to RSS Feed
- Permalink
- Report Inappropriate Content
Hi Annick,
You should follow the example described here:
World Mapping File For Qlik Sense Maps (KML Shape and Point)
Hope this helps!
-Nuno
- Mark as New
- Bookmark
- Subscribe
- Mute
- Subscribe to RSS Feed
- Permalink
- Report Inappropriate Content
Hi Annick,
You should follow the example described here:
World Mapping File For Qlik Sense Maps (KML Shape and Point)
Hope this helps!
-Nuno
- Mark as New
- Bookmark
- Subscribe
- Mute
- Subscribe to RSS Feed
- Permalink
- Report Inappropriate Content
Hi Annick,
You should probably use a polygon map with KML file here.
This video should help:
Using the Maps Chart Object - Polygon Map - Part 2 - (video)
Also check this link. It has a world KML file which you can use.
KML US and World Map and Sample Data
Regards,
Rohan
- Mark as New
- Bookmark
- Subscribe
- Mute
- Subscribe to RSS Feed
- Permalink
- Report Inappropriate Content
Hello Rohan,
hanks a lot! it works very well!
Annick