Unlock a world of possibilities! Login now and discover the exclusive benefits awaiting you.
- Qlik Community
- :
- Forums
- :
- Analytics
- :
- New to Qlik Analytics
- :
- Re: Missing bars in bar chart (advanced)
- Subscribe to RSS Feed
- Mark Topic as New
- Mark Topic as Read
- Float this Topic for Current User
- Bookmark
- Subscribe
- Mute
- Printer Friendly Page
- Mark as New
- Bookmark
- Subscribe
- Mute
- Subscribe to RSS Feed
- Permalink
- Report Inappropriate Content
Missing bars in bar chart (advanced)
Hi everybody
In my last post (Missing bars in bar Chart) I was wondering how I can add missing bars in a bar chart with a predefined bin size.
i.e i want to plot the Count of y where y =(0,1,1.5,5,6) in a bar plot with bins 0-2, 2-4, 4-6 and i want to see the bin 2-4 with Count 0.
This Problem could be solved by Alex Timofeyev, thanks a lot. His answer can be found here: Missing bars in bar Chart.
Now my next question: I want to have a more dynamical bar chart where i always see around 10 bars independent of the drilldown level ( or another Number depending on a user input, but i don't include this since probably not all of you have this add-on).
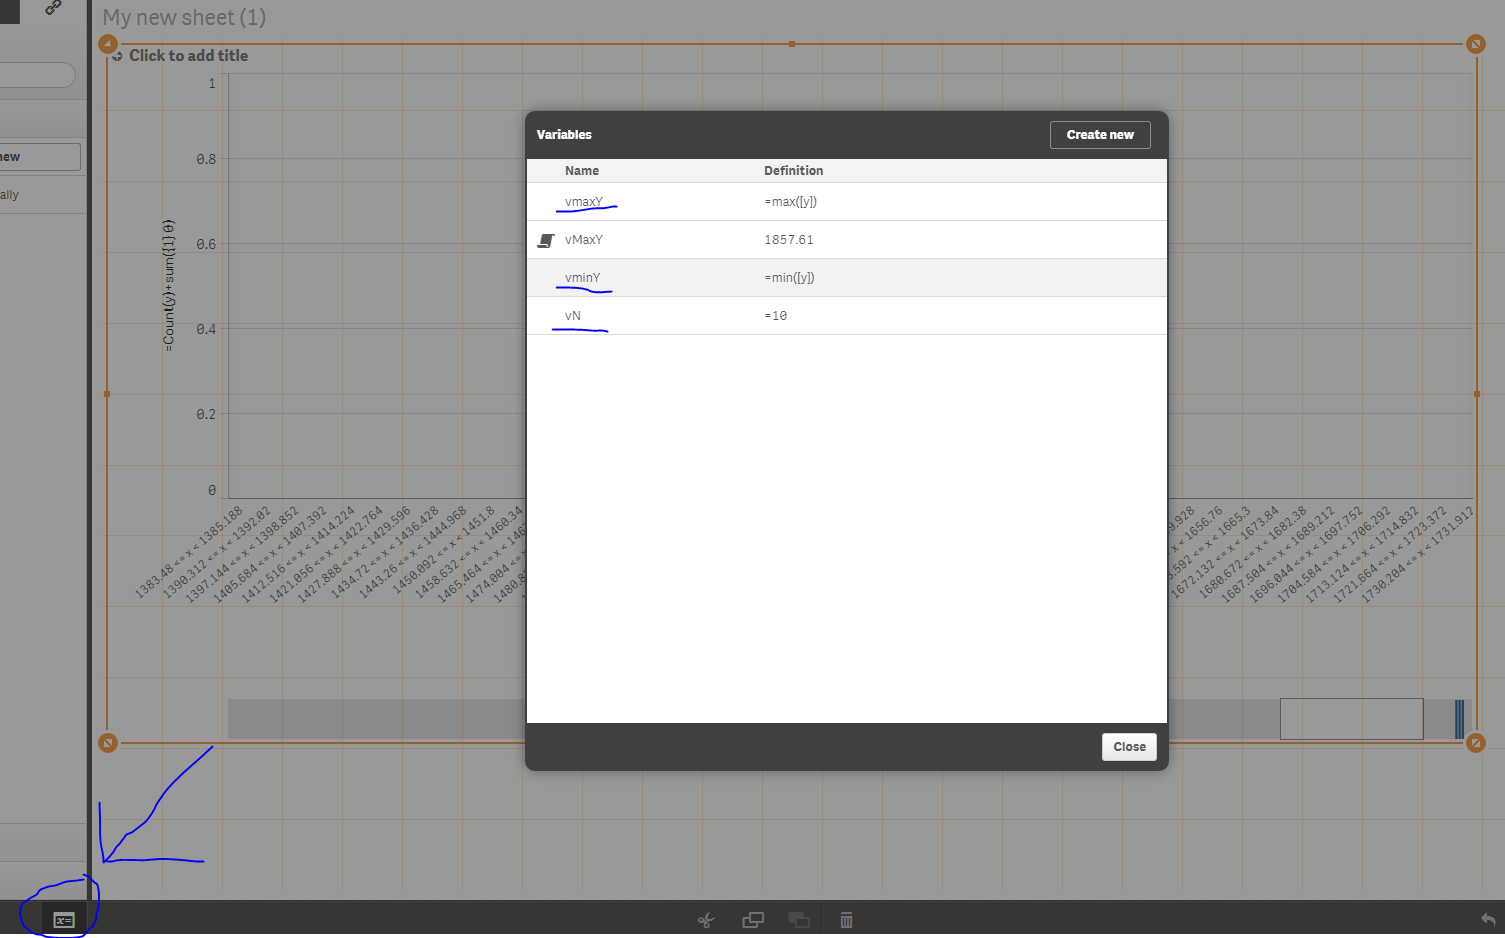
To achive that i created the variables: vminy=min(
In vN the desired number of bins are stored.
The Dimension has the form [bins for y dynamically] = class(y , ( $(vmaxy)-$(vminy) )/ $(vN) )
In the bar chart I plot [bins for y dynamically] and Count(y).
If I drill down much into y i see jumps between the boundaries of the bins.
I would like to add bins which show a count 0 betwwen. ( see Level2.png)
I attache my testworkbook: test.qvf (and 2 png files to clarify my question
- « Previous Replies
-
- 1
- 2
- Next Replies »
- Mark as New
- Bookmark
- Subscribe
- Mute
- Subscribe to RSS Feed
- Permalink
- Report Inappropriate Content
To force all your data points that would otherwise be null to be zero use this for your expression :
Count(y) + sum( {1} 0 )
And under Data Handling tick Show zero values
I am not convinced that is the entire end game you are after though.
Also your Calculated Dimension expression is :
class(y,( $(vmaxY)-$(vminY))/$(vN))
But I cannot see where variables vmaxY and vN are defined.
- Mark as New
- Bookmark
- Subscribe
- Mute
- Subscribe to RSS Feed
- Permalink
- Report Inappropriate Content
Hi Bill
Varaible can be declared on the left bottom side (see Example 1.png).
Thanks for your efford but it's not that I'm looking for...
Let me make a small example: I want a bar plot with always vN Bars starting at vminy and ending at vminy.
Bars should also be shown if no value lies in it.
Let's look at an example:
y=(0,2,4,6,7,8) (Values to Plot)
vN=4
So we have vminy=0, vmaxY=8 and Class(y,(vmaxY-vminY)/vN,'x',vminY) simplifies to Class(y,2,'x',0) which returns
'0<=x<2' (with Count(y)= 1)
'2<=x<4' (with Count(y) =1)
'4<=x<6' (with Count(y) =1)
'6<=x<8' (with Count(y) =2)
'8<=x<10' (with Count(y)=1)
The Problem appears if we drill down on y
Let's say we only choose the values 0 and 4 for y.
Based on this selection we have vminY=0 and ymaxY=4.
Class(y,(vmaxY-vminY)/vN,'x',vminY) simplifies to Class(y1,'x',0) and returns
'0<=x<1' (with Count(y)=1)
'4<=x<5' (with Count(y) =1)
With your method we would get
'0<=x<1' (1 )
'2<=x<3' (0)
'4<=x<5' (1)
'6<=X<7' (0)
'8<=X<9' (0)
I have 2 proplems with this result:
1) The intervals '1<=x<2', '3<=x<4' are not shown in my plot.
2) Intervals on the right side of 4 are still shown.
I would like somthing like
'0<=x<1' (1 )
'2<=x<3' (0)
'3<=x<4' (0)
'4<=X<5' (1)
I want to achive that no jumps in the x-axis occures....
A nice solution for a similar but simpler problem is describt in my last post 'Missing bars in bar chart'.
Sorry for the Long post but at least it should be clear now that i mean
Cheers,
David
- Mark as New
- Bookmark
- Subscribe
- Mute
- Subscribe to RSS Feed
- Permalink
- Report Inappropriate Content
Bill,
those variables are defined in the UI, not data load script.
- Mark as New
- Bookmark
- Subscribe
- Mute
- Subscribe to RSS Feed
- Permalink
- Report Inappropriate Content
Strange, I could not find them in the UI or the script. Maybe I was looking in the wrong place or they got lost in transit.
- Mark as New
- Bookmark
- Subscribe
- Mute
- Subscribe to RSS Feed
- Permalink
- Report Inappropriate Content
please check the attached app - is this something close to what you were trying to achieve?
Alex
- Mark as New
- Bookmark
- Subscribe
- Mute
- Subscribe to RSS Feed
- Permalink
- Report Inappropriate Content
Hi Alex
Yes it is really close!
Some differences to my initial idea but this doesn't matter.
I think i will Change the rounding behaviour in the class function but this isn't to important.
One things still bugs me:
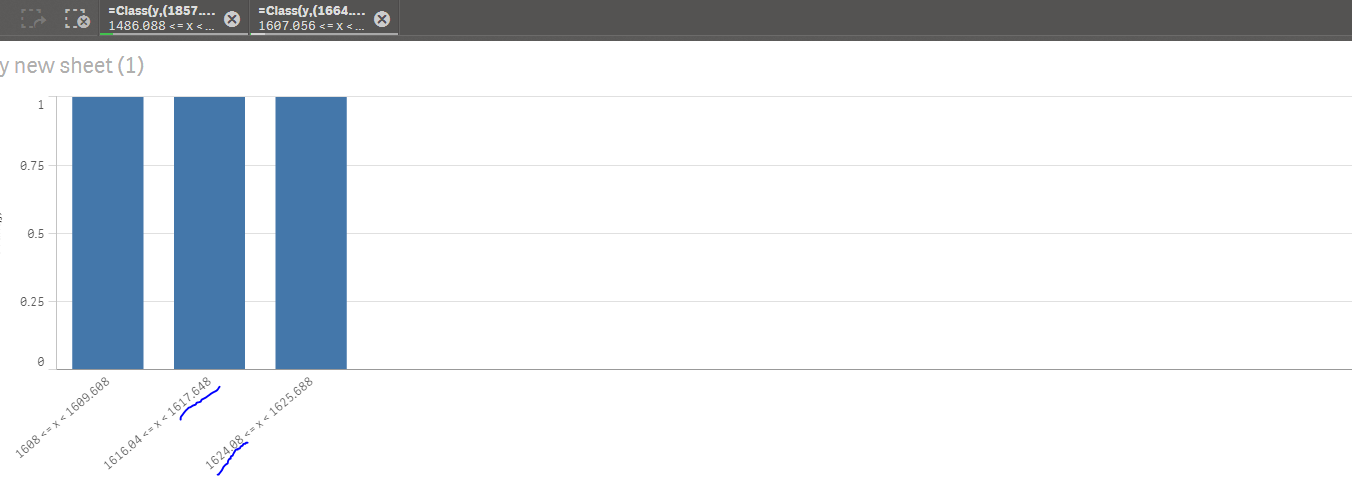
If I select the bins 0<=x<93 and 1767<=x<1860 and drill down on them i end up with only 2 bars and the intermidiate bars are missing. If i drill down only on a single bar this doesn't happen.
Any idea why this happens?
Otherwise the graph looks realy nice 🙂
Cheers
David
- Mark as New
- Bookmark
- Subscribe
- Mute
- Subscribe to RSS Feed
- Permalink
- Report Inappropriate Content
Hi David,
if you select two non-consecutive bars, there are no
- Mark as New
- Bookmark
- Subscribe
- Mute
- Subscribe to RSS Feed
- Permalink
- Report Inappropriate Content
Hi Alex
Ok I see. Can it be modified?
How did you create
Cheers,
David
- Mark as New
- Bookmark
- Subscribe
- Mute
- Subscribe to RSS Feed
- Permalink
- Report Inappropriate Content
Check the data load script in my app.
- « Previous Replies
-
- 1
- 2
- Next Replies »