Unlock a world of possibilities! Login now and discover the exclusive benefits awaiting you.
- Qlik Community
- :
- Forums
- :
- Analytics & AI
- :
- Products & Topics
- :
- App Development
- :
- Re: 100% Stacked bar chart in Qlik Sense
- Subscribe to RSS Feed
- Mark Topic as New
- Mark Topic as Read
- Float this Topic for Current User
- Bookmark
- Subscribe
- Mute
- Printer Friendly Page
- Mark as New
- Bookmark
- Subscribe
- Mute
- Subscribe to RSS Feed
- Permalink
- Report Inappropriate Content
100% Stacked bar chart in Qlik Sense
Dear Community
I wonder how can I build a 100% Stacked bar chart in Qlik Sense. My case is the follows.

The result I want is to measure the number of occurrences of Type in Month.

However, I don't know how to build it in Qlik sense.As I already set:
Dimensions:
1. Month (Date)
2. Type
Style = stacked
Show in percent
Static max 1
How can I set the expression in Measures?
Thank you very much. Please give me a helping hand.
- Tags:
- bar-chart
- qlik sense
Accepted Solutions
- Mark as New
- Bookmark
- Subscribe
- Mute
- Subscribe to RSS Feed
- Permalink
- Report Inappropriate Content
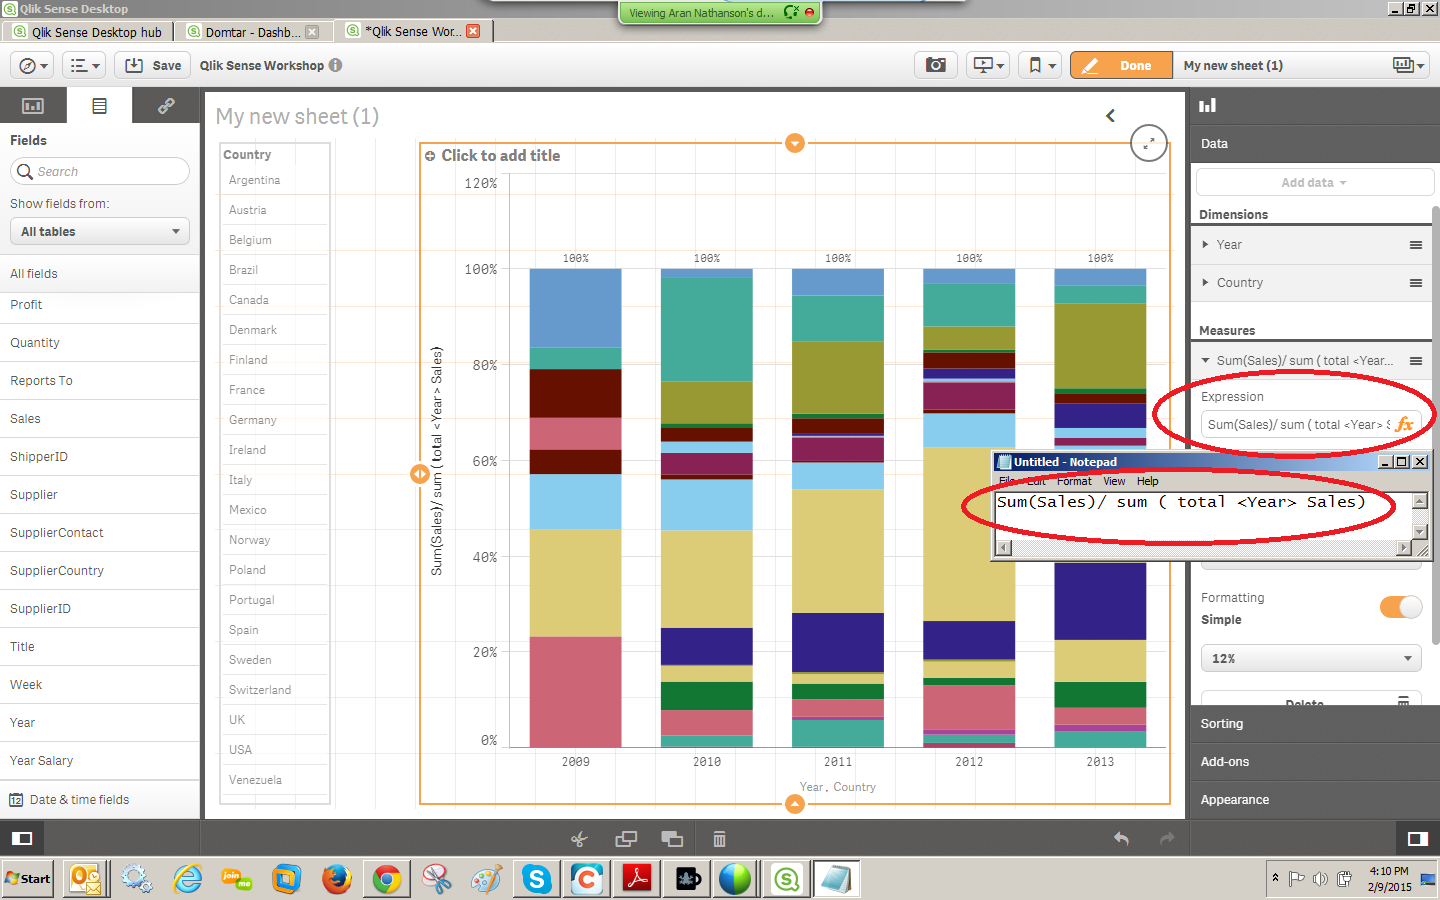
Here is a sample.
My measure is sum(Sales).
But to get a relative contribution i changed it to: sum(Sales) / sum( TOTAL <Year> Sales)
The denominator calculates the total Yearly value. And with Year as the bars, it will do a share of 100% calculation
- Mark as New
- Bookmark
- Subscribe
- Mute
- Subscribe to RSS Feed
- Permalink
- Report Inappropriate Content
Jonathan Poole Thank you very much for help. But I still can't build the table.
However, in my case, my original data format in date is in a whole date (1/1/2015) not only a month (1).
Dimensions:
1. Month (Date)
2. Type
If I type
Measure: count(Type) / count( TOTAL <Date> Type)
The result is not I want to be as it count the Type per month over the Total type of all records.
If I type
Measure: count(Type) / count( TOTAL <Month (Date)> Type)
It can't show any thing because it is wrong expression.
What I want is Type per month over the Total Types within a month. How can I do the data transforming from Date to Month and available to use in the Measure in Qlik Sense?
Thank you very much for answering.
- Mark as New
- Bookmark
- Subscribe
- Mute
- Subscribe to RSS Feed
- Permalink
- Report Inappropriate Content
You can load in a new field in your data model to store the months:
Load
Date
from ...
to:
Load
Date,
Month(Date) as Month
from ...
Then use the 'month' field as a dimension in your chart and in the TOTAL clause of the measure expression.
Does this make sense ?
- Mark as New
- Bookmark
- Subscribe
- Mute
- Subscribe to RSS Feed
- Permalink
- Report Inappropriate Content
Jonathan PooleThank you very much. I am able to create the 100% stacked bar chart and the field form data load editor that I want in Qlik Sense. You are very smart and very nice for helping me. Much Thanks
 .
.
- Mark as New
- Bookmark
- Subscribe
- Mute
- Subscribe to RSS Feed
- Permalink
- Report Inappropriate Content
How we can show the Split-up of Contribution Values inside the chart