Unlock a world of possibilities! Login now and discover the exclusive benefits awaiting you.
- Qlik Community
- :
- Forums
- :
- Analytics
- :
- App Development
- :
- Calculate sum of a field based on a date field fro...
- Subscribe to RSS Feed
- Mark Topic as New
- Mark Topic as Read
- Float this Topic for Current User
- Bookmark
- Subscribe
- Mute
- Printer Friendly Page
- Mark as New
- Bookmark
- Subscribe
- Mute
- Subscribe to RSS Feed
- Permalink
- Report Inappropriate Content
Calculate sum of a field based on a date field from a different master calendar
Hi All,
I got two data sets (Sales and Staff Hours worked). Basically, I am trying to compare the staff hours worked against the Sales they have performed.
I got two date fields in each data set table and each table is linked to a Master Calendar (Thus, got two Master Calendars).
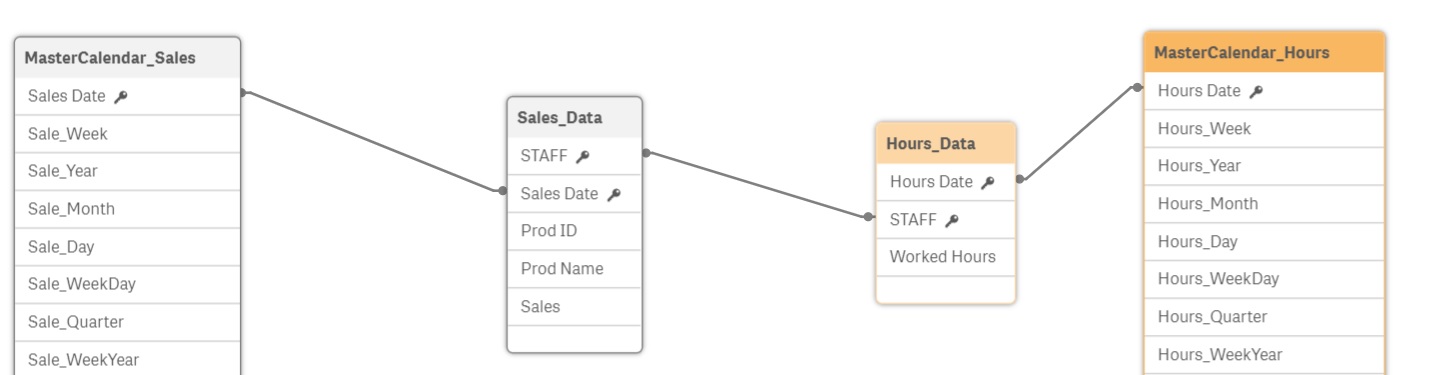
My data model viewer looks like below (Please refer the attachment)
According to the above diagram, the Sales related data linked to "Sales Date" field and staff hours worked data linked to "Hours Date" field. Suppose, I am comparing the Sales data and the Worked Hours data on the same table in the data visualization platform, how can I link those two date objects? or,
Is there a different way to work around this?
My final output should looks something like this,
| Sale_Month | STAFF | Sales | Hours Worked |
| July | Mark | 5000 | 20 |
| August | Mark | 4500 | 22 |
| September | Mark | 3500 | 15 |
| July | Vince | 6000 | 30 |
| August | Vince | 7500 | 35 |
| September | Vince | 8000 | 37 |
Since, I have used the MasterCalendar_Sales, it correctly calculates the total Sales against the Sales Staff but not the respective Worked Hours because the date field for Worked Hours is from MasterCalendar_Hours.
Appreciate your feedback.
Thank you in advance.
Kind regards,
Andy
- Mark as New
- Bookmark
- Subscribe
- Mute
- Subscribe to RSS Feed
- Permalink
- Report Inappropriate Content
Maybe concatenating both table may help you out:

Script:
Sales_Data:
load STAFF,Date#([Sales Date],'DD/MM/YYYY') as Date,[Prod ID],[Prod Name],Sales,'Sales' as Table inline [
STAFF,Sales Date,Prod ID,Prod Name,Sales
A123,16/12/2019,A100,ABC,100
A234,17/11/2019,A200,BCD,200
A123,20/10/2019,A200,BCD,100
A456,21/9/2019,A100,ABC,88
];
Concatenate
Hours_Data:
load Date#([Hours Date],'DD/MM/YYYY') as Date,STAFF,[Worked Hours],'Hours' as Table inline [
Hours Date,STAFF,Worked Hours
15/12/2019,A123,8
16/12/2019,A123,8
16/10/2019,A123,8
15/11/2019,A234,8
16/11/2019,A234,8
17/11/2019,A234,8
15/9/2019,A456,8
16/9/2019,A456,8
17/9/2019,A456,8
19/9/2019,A456,8
18/9/2019,A456,8
];

SalesDate:
load min([Date]) as minSalesDate,
	 max([Date]) as maxSalesDate
resident Sales_Data;

let vSalesMin = peek('minSalesDate',0,'SalesDate');
let vSalesMax = peek('maxSalesDate',0,'SalesDate');


Calendar:
load Date($(vSalesMin)-1+IterNo(),'DD/MM/YYYY') as Date,
	 Month(Date($(vSalesMin)-1+IterNo(),'DD/MM/YYYY')) as Month
AutoGenerate 1
while $(vSalesMin)-1+IterNo()< $(vSalesMax)+1;


exit script;
Uncheck 'include null values' for each dimensions.
- Mark as New
- Bookmark
- Subscribe
- Mute
- Subscribe to RSS Feed
- Permalink
- Report Inappropriate Content
Hi,
Thank you very much for your quick reply.
However, this seems like creating an isolated table named, "SalesDate" according to the data model viewer.
Further, I would like to keep both the Master Calendars if possible, and could you please suggest me a method to calculate the sum of "Worked Hours" for each "STAFF" member.
Sales --> Sum(Sales)
Hours Worked --> ?
The other field of the table will be just the dimensions of, "STAFF" and "Sale_Month"
Appreciate your feedback.
Kind regards,
Andy
- Mark as New
- Bookmark
- Subscribe
- Mute
- Subscribe to RSS Feed
- Permalink
- Report Inappropriate Content
If that is the case, can you provide a sample qvf?
So that we can work based on your data model.
- Mark as New
- Bookmark
- Subscribe
- Mute
- Subscribe to RSS Feed
- Permalink
- Report Inappropriate Content
Try this:
Sum(if(SalesMonth=HoursMonth,[Worked Hours]))
- Mark as New
- Bookmark
- Subscribe
- Mute
- Subscribe to RSS Feed
- Permalink
- Report Inappropriate Content
Hi Arthur,
Thanks a lot for the reply.
I'll try it and give you an update.
Kind regards,
Andy
- Mark as New
- Bookmark
- Subscribe
- Mute
- Subscribe to RSS Feed
- Permalink
- Report Inappropriate Content
Hi Arthur,
I tried the provided expression but did not give me the intended output.
Unfortunately, I do not have the access to our Qlik Sense server at work place so can't supply the "qvf" file.
However, I'll run it on my home computer and will send you the respective "qvf/ qvd" file.
Thank you.
Kind regards,
Andy