Unlock a world of possibilities! Login now and discover the exclusive benefits awaiting you.
Announcements
Q&A with Qlik - Qlik Cloud Migration: Questions about migrating to Qlik Cloud? Catch the latest replay!
- Qlik Community
- :
- Forums
- :
- Analytics & AI
- :
- Products & Topics
- :
- App Development
- :
- Change colors in QLikSense bar chart to custom col...
Options
- Subscribe to RSS Feed
- Mark Topic as New
- Mark Topic as Read
- Float this Topic for Current User
- Bookmark
- Subscribe
- Mute
- Printer Friendly Page
Turn on suggestions
Auto-suggest helps you quickly narrow down your search results by suggesting possible matches as you type.
Showing results for
Contributor III
2018-09-11
09:05 AM
- Mark as New
- Bookmark
- Subscribe
- Mute
- Subscribe to RSS Feed
- Permalink
- Report Inappropriate Content
Change colors in QLikSense bar chart to custom colors (1 dimension, 2 measurements)
I tried to change the colors of a QLikSense bar-chart that has one dimension (WekenJaarWeek) and two measurements (=SaldoOHWNat, =SaldoOHWInt).
My current graph when using the automatic generated colors is:
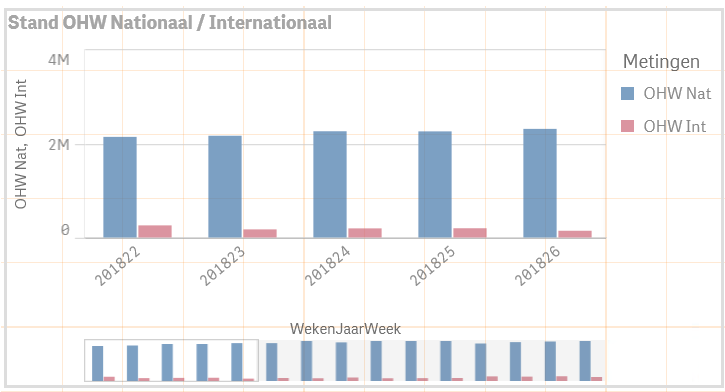
I'd like to change the colors to the variables Kleur1 and Kleur2
Kleur1 = RGB(183, 190, 85)
Kleur2 = RGB(226, 230, 204)
I already changed to custom colors > On expression and used the following expression:
if(SaldoOHWNat, Kleur1,
if(SaldoOHWInt, Kleur2))
This results in the graph:
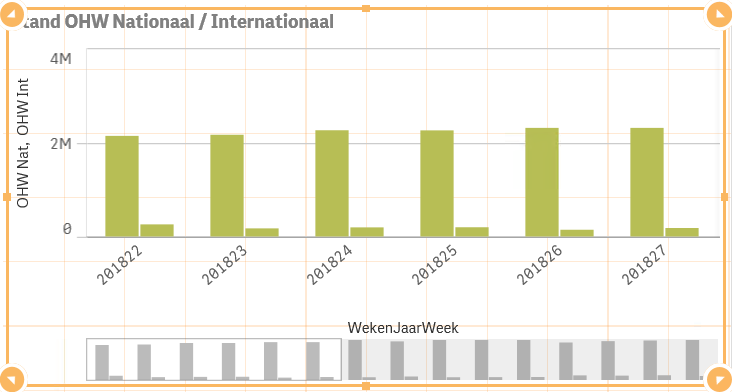
I need that the lower bars gets the color of the RGB value of Kleur2.
- Tags:
- custom colour
713 Views
1 Reply
Champion
2018-09-11
09:14 AM
- Mark as New
- Bookmark
- Subscribe
- Mute
- Subscribe to RSS Feed
- Permalink
- Report Inappropriate Content
Hi,
this code means what ?
if(SaldoOHWNat, Kleur1,
if(SaldoOHWInt, Kleur2))
688 Views