Unlock a world of possibilities! Login now and discover the exclusive benefits awaiting you.
- Qlik Community
- :
- Forums
- :
- Analytics & AI
- :
- Products & Topics
- :
- App Development
- :
- Correct Denominator in Pie Charts
- Subscribe to RSS Feed
- Mark Topic as New
- Mark Topic as Read
- Float this Topic for Current User
- Bookmark
- Subscribe
- Mute
- Printer Friendly Page
- Mark as New
- Bookmark
- Subscribe
- Mute
- Subscribe to RSS Feed
- Permalink
- Report Inappropriate Content
Correct Denominator in Pie Charts
I’m attempting to create a series of pie charts. Unfortunately, I cannot get the denominator for the percentage calculation to work correctly. Here’s what I’m trying to do - I’m providing a small example.
I have Customer Table that has a CustomerID field (Let’s say there are 5 companies):
CustomerID
1
2
3
4
5
I have a product table called Products - (lets say in works like this):
ProdCode Product
201 Cell Phone
202 Laptop
203 Television
204 Desktop Computer
I have an ongoing table of purchases by customer - lets call it SalesData. Those customers could purchase more than one product, such as:
CustomerID ProdCode
1 201
2 201
2 204
3 204
3 203
3 202
4 201
1 203
5 202
2 203
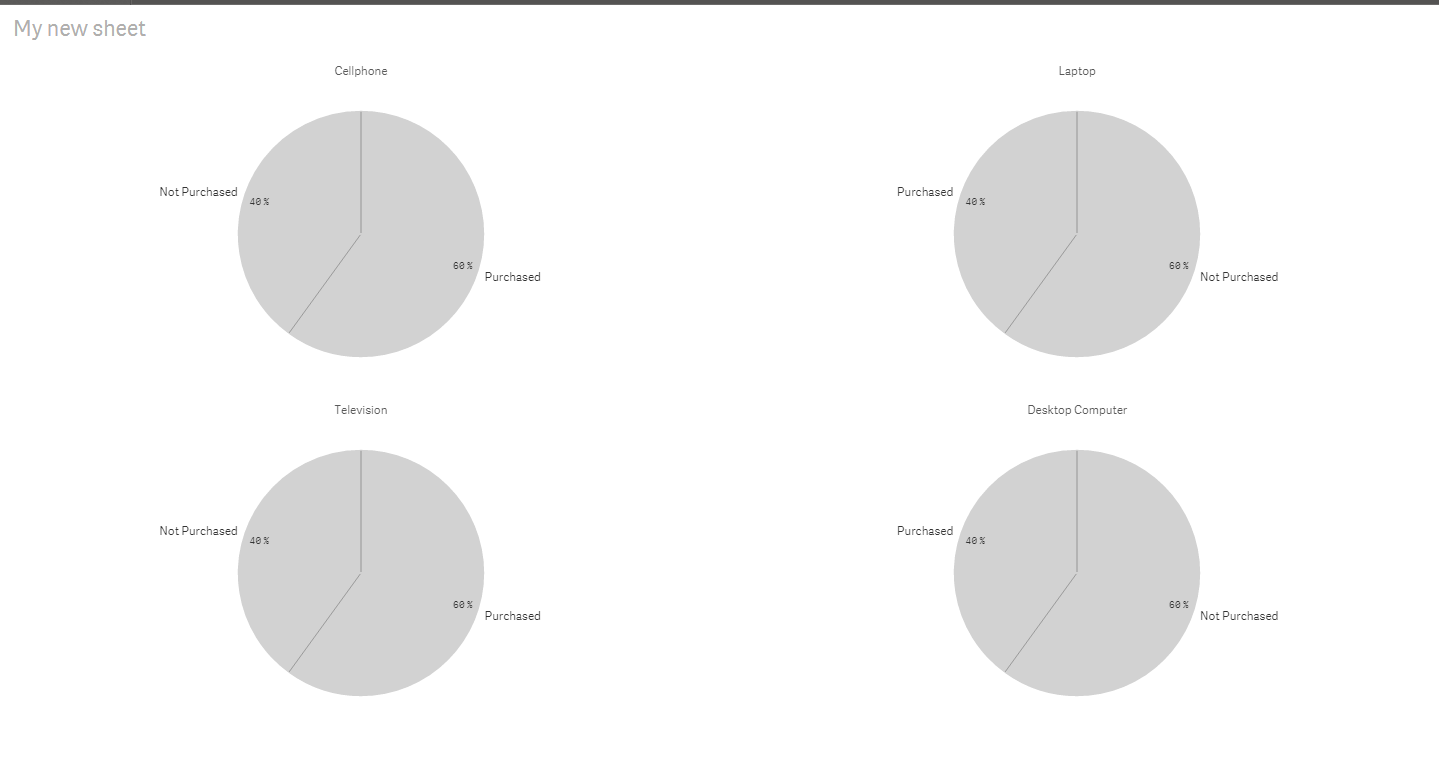
So, in this example, I have a Customer Key Field - CustomerID and there are 4 Unique products. I have Unique Key for the Products table and I utilize both Keys in the SalesData table. I’m interested in creating Pie Charts for each Product sold and have those pie charts say what percentage of the entire customer population has purchased that product. The answers should be as follows:
Cell Phone - 3 out of 5 customers or 60% purchased, and 40% did not.
Laptop - 2 out of 5 customers or 40% purchased, and 60% did not.
Television - 3 out of 5 customers or 60% purchased, and 40% did not.
Desktop - 2 out of 5 customers or 40% purchased, and 60% did not.
So, what am I getting when I create a pie chart? Let’s look at Cell Phones -
I get a slice that has 3 Cell Phones purchased with and 5 that did not (it should be 2) or 37.5% who purchased and 62.5% who did not. It looks at the total number of customers who purchased a cell phone (3) and then looks at the total unique customer (5) and gives me values of 3 who purchased and 5 who did not. I'm just not sure why it doesn't look at the total of 5 customers and give me the correct percentages from the 5 unique customers.
The Dimension I use is = if(ProdCode = 201, ‘Cell Phone’, ‘No Cell Phone’). This gets me my 3 customers and correct labeling.
I’ve used a ton of expressions, but currently I use: =count(distinct(CustomerID).
I’ve tried set analysis, I’ve looked into AGGR(), I’m just confused at this point. I've done searches on line, YouTube, here on the community and I have not figured it out. Sorry if this has been answered somewhere before. I'm sure it's user error, but...
Can someone help?
Thank you,
Rick
Accepted Solutions
- Mark as New
- Bookmark
- Subscribe
- Mute
- Subscribe to RSS Feed
- Permalink
- Report Inappropriate Content
- Mark as New
- Bookmark
- Subscribe
- Mute
- Subscribe to RSS Feed
- Permalink
- Report Inappropriate Content
Like this?
- Mark as New
- Bookmark
- Subscribe
- Mute
- Subscribe to RSS Feed
- Permalink
- Report Inappropriate Content
Sunny, Thank you very much. That worked. I appreciate it. Rick
- Mark as New
- Bookmark
- Subscribe
- Mute
- Subscribe to RSS Feed
- Permalink
- Report Inappropriate Content
That is awesome 
Please close the thread by marking correct answer.
Best,
Sunny