Unlock a world of possibilities! Login now and discover the exclusive benefits awaiting you.
- Qlik Community
- :
- Forums
- :
- Analytics
- :
- App Development
- :
- Re: Create Waterfall chart in Qlik Sense with Prod...
- Subscribe to RSS Feed
- Mark Topic as New
- Mark Topic as Read
- Float this Topic for Current User
- Bookmark
- Subscribe
- Mute
- Printer Friendly Page
- Mark as New
- Bookmark
- Subscribe
- Mute
- Subscribe to RSS Feed
- Permalink
- Report Inappropriate Content
Create Waterfall chart in Qlik Sense with Products as colour share in each bar
Hello,
Greetings.
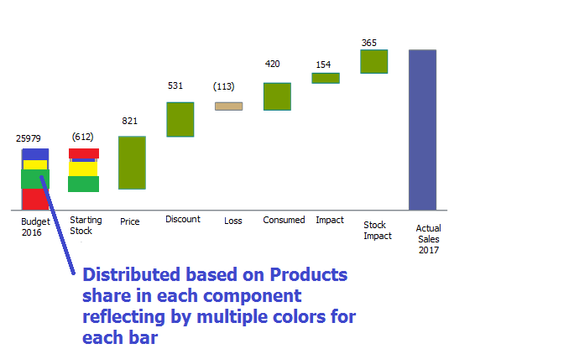
I need to create a Waterfall chart as can be seen in attachment (Result.png) in Qlik Sense based on the data below. (See Attached Excel).
In Every bar the Products should represent the contribution it has made in each bar by color (Stacked).
Any swift help in this regards would be appreciate.
TIA.
- Mark as New
- Bookmark
- Subscribe
- Mute
- Subscribe to RSS Feed
- Permalink
- Report Inappropriate Content
I don't believe stacked bar is currently supported in the waterfall chart
There may be a way to hack the combo chart to look like a waterfall by using custom coloring to hide the bottom of the stack and make the bars appear to float. Sort of how Qlikview does the bar start. But I'd be reluctant to make something that complicated.
I believe VizLib is coming up with a waterfall chart soon. Probably other options in Qlik Branch as well
- Mark as New
- Bookmark
- Subscribe
- Mute
- Subscribe to RSS Feed
- Permalink
- Report Inappropriate Content
Hi,
Please find below URL,
Hopefully it will help you
Thanks
Tushar
- Mark as New
- Bookmark
- Subscribe
- Mute
- Subscribe to RSS Feed
- Permalink
- Report Inappropriate Content
Hello Tushar,
Many thanks for the swift response but this is for Qlikview and i tried the same but unable to achieve the desire results.
Thanks and Regards,
Hassam.
- Mark as New
- Bookmark
- Subscribe
- Mute
- Subscribe to RSS Feed
- Permalink
- Report Inappropriate Content
In case your question is still relevant, we have a Waterfall Chart in the AnyChart extension for Qlik Sense. In general, this tool is similar to the default QS Waterfall Chart but supports subcategories (shown as stacked sub-bars) and provides a wider range of options. Check out the AnyChart Waterfall Chart Documentation to make sure that's what you want.
- Mark as New
- Bookmark
- Subscribe
- Mute
- Subscribe to RSS Feed
- Permalink
- Report Inappropriate Content
Will it filter out when we click on the legend in Any chart advanced waterfall chart?
Currently I am using the trial version and it doesn't filter when clicked on legend ,but in a normal bar chart it does filter out

