Unlock a world of possibilities! Login now and discover the exclusive benefits awaiting you.
- Qlik Community
- :
- Forums
- :
- Analytics & AI
- :
- Products & Topics
- :
- App Development
- :
- Re: Custom pop-up message at charts
- Subscribe to RSS Feed
- Mark Topic as New
- Mark Topic as Read
- Float this Topic for Current User
- Bookmark
- Subscribe
- Mute
- Printer Friendly Page
- Mark as New
- Bookmark
- Subscribe
- Mute
- Subscribe to RSS Feed
- Permalink
- Report Inappropriate Content
Custom pop-up message at charts
Hi Everyone!
Our costumer would like to see some explanation at all charts and objects.
It would be the best solution, if he/she got a pop-up like window when his/her mouse is over the objects.
Is it possible to create either a pop-up like box, or any on-mouse based explanation guide?
I can't find any extension related the topic.
Thanks!
Best regards,
G.
- « Previous Replies
- Next Replies »
Accepted Solutions
- Mark as New
- Bookmark
- Subscribe
- Mute
- Subscribe to RSS Feed
- Permalink
- Report Inappropriate Content
Hi Undergrinder,
I had a similar requirement, So I built a custom pop up which will explain all the KPI's in a sheet. Once clicked on the ? button, a pop up slides down with the explanations for all KPI's on the screen.
Please find attached a sample for this functionality attached.I have only removed the images from the images folder. You can replicate something like this for your purpose.
Hope this helps! ! !
- Sangram Reddy
- Mark as New
- Bookmark
- Subscribe
- Mute
- Subscribe to RSS Feed
- Permalink
- Report Inappropriate Content
Hi there,
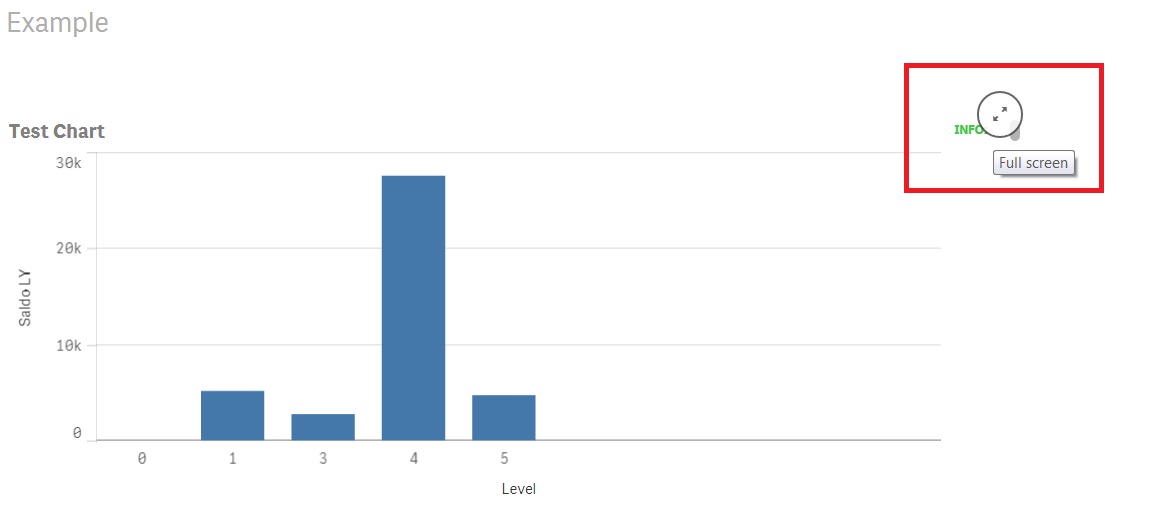
The workaround we use - 'Text and image' chart. Make as small as possible.
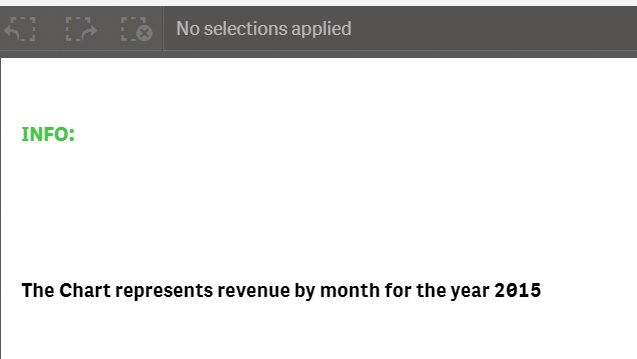
In a View mode hover over the chart until you see 'full screen ' function. Click on it, go to Edit mode, type whatever you need, exit Edit mode. You're done!
Hope that helps!
Cheers,
Linas
Cheers Linas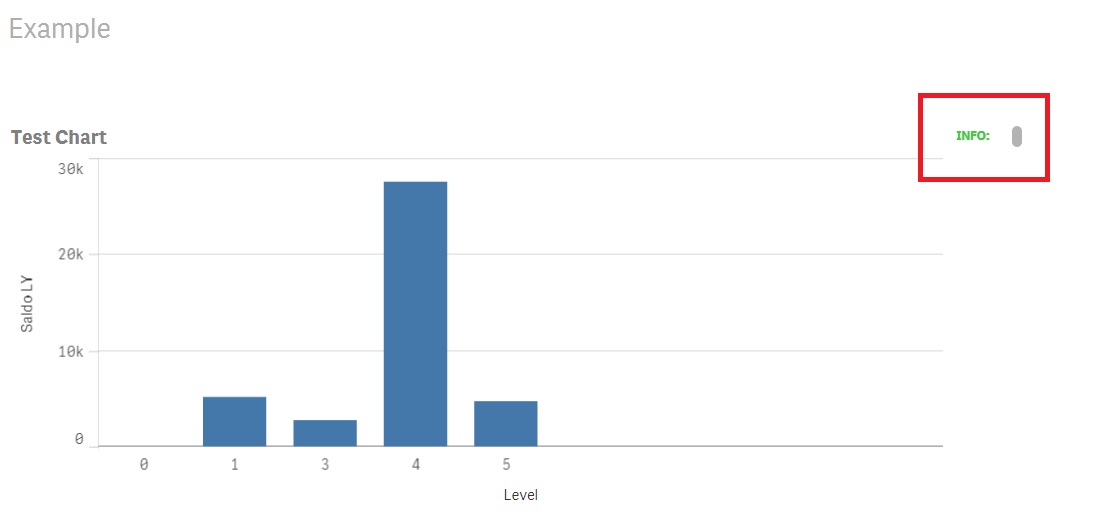
- Mark as New
- Bookmark
- Subscribe
- Mute
- Subscribe to RSS Feed
- Permalink
- Report Inappropriate Content
Hi Linas!
Thank your suggestion it is useful.
I've already tried this method, but it consumes more place in grid than it would be acceptable.
An other workaorund is for custom explanation message is the following:
- Create a variable in load script, e.g. vShowMessage
- Import variable button like extension
- Place every object subtitle the message as formula like this: if($(vShowMessage)=1,'Some explanation','')
- The explanation text will appaer in subtitle, if the user click on the button.
G.
- Mark as New
- Bookmark
- Subscribe
- Mute
- Subscribe to RSS Feed
- Permalink
- Report Inappropriate Content
Hi undergrinder,
Yeah this was a challenge for me as well. So, for which I can up with some thing like this.
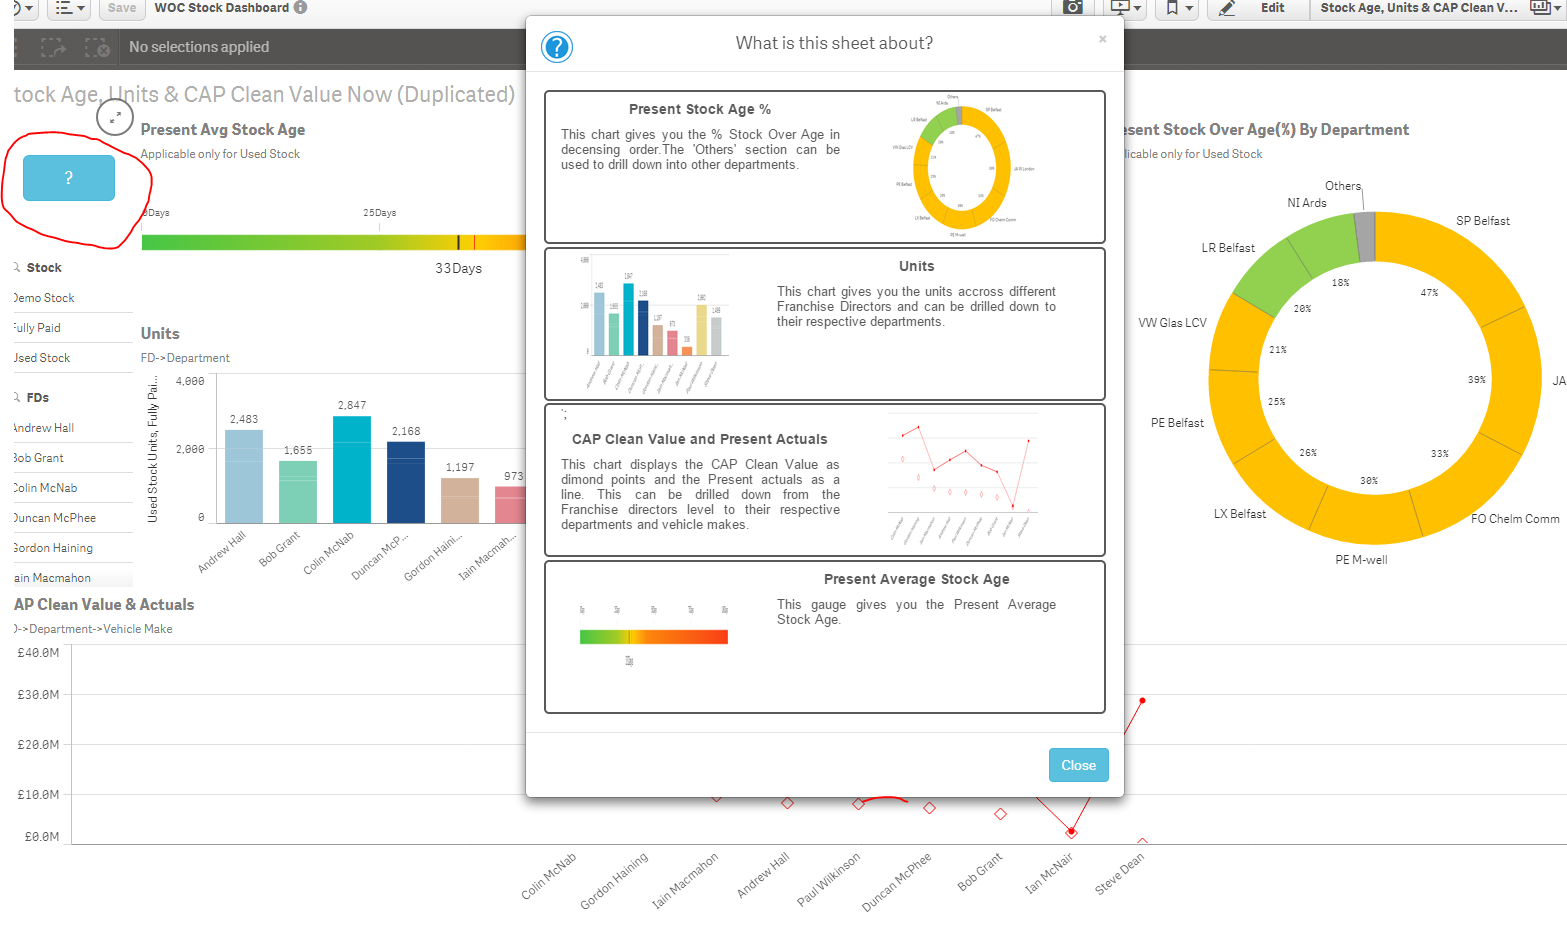
This will give you the essential documentation for all the KPI's displayed on the sheet.
Hope this is useful!
Thanks and Regards,
Sangram Reddy.
- Mark as New
- Bookmark
- Subscribe
- Mute
- Subscribe to RSS Feed
- Permalink
- Report Inappropriate Content
Hi Sangram!
Wow it looks very nice!
What kind of object or extension did you make with?
Could you share some hint or explanation with us? 
Thank you!
G.
- Mark as New
- Bookmark
- Subscribe
- Mute
- Subscribe to RSS Feed
- Permalink
- Report Inappropriate Content
Hi Undergrinder,
I had a similar requirement, So I built a custom pop up which will explain all the KPI's in a sheet. Once clicked on the ? button, a pop up slides down with the explanations for all KPI's on the screen.
Please find attached a sample for this functionality attached.I have only removed the images from the images folder. You can replicate something like this for your purpose.
Hope this helps! ! !
- Sangram Reddy
- Mark as New
- Bookmark
- Subscribe
- Mute
- Subscribe to RSS Feed
- Permalink
- Report Inappropriate Content
Hi Sangram,
Thank you very much!
Works great, I like this approach, looks like ornaments of heaven
G.
- Mark as New
- Bookmark
- Subscribe
- Mute
- Subscribe to RSS Feed
- Permalink
- Report Inappropriate Content
Hi Sangram!
The modal solution works good at 1.1, but there is a problem with Qlik Sense 2.1.1.
The modal appear, but the sense object is still active behind the modal.
It is like z-index problem, but the edit of CSS don't solve the problem.
Could suggest me some trick to solve this?
Thank you very much!
UPDATE:
It seems that, the modal works well only in parent object in QS 2.1.1, in other cases has problem.
G.
- Mark as New
- Bookmark
- Subscribe
- Mute
- Subscribe to RSS Feed
- Permalink
- Report Inappropriate Content
Hi undergrinder,
It could be the z-index as you have mentioned. May be you should some other bootstrap. I haven't got a chance to look at this. I will look into this as well.
- Mark as New
- Bookmark
- Subscribe
- Mute
- Subscribe to RSS Feed
- Permalink
- Report Inappropriate Content
Thank You!
I'll work on this as well, for solution.
G.
- « Previous Replies
- Next Replies »