Unlock a world of possibilities! Login now and discover the exclusive benefits awaiting you.
- Qlik Community
- :
- Forums
- :
- Analytics & AI
- :
- Products & Topics
- :
- App Development
- :
- Directed acyclic graph (DAG) for Process Monitorin...
- Subscribe to RSS Feed
- Mark Topic as New
- Mark Topic as Read
- Float this Topic for Current User
- Bookmark
- Subscribe
- Mute
- Printer Friendly Page
- Mark as New
- Bookmark
- Subscribe
- Mute
- Subscribe to RSS Feed
- Permalink
- Report Inappropriate Content
Directed acyclic graph (DAG) for Process Monitoring in Qlik Sense
Hello everybody,
my question is about DAG and its visualization.
As a beginner in Data Analysis and performing not as Developer or Programmer, it would be great to find a ready extension for Qlik Sense as I did for Qlik View.
http://branch.qlik.com/#!/project/56728f52d1e497241ae6978a
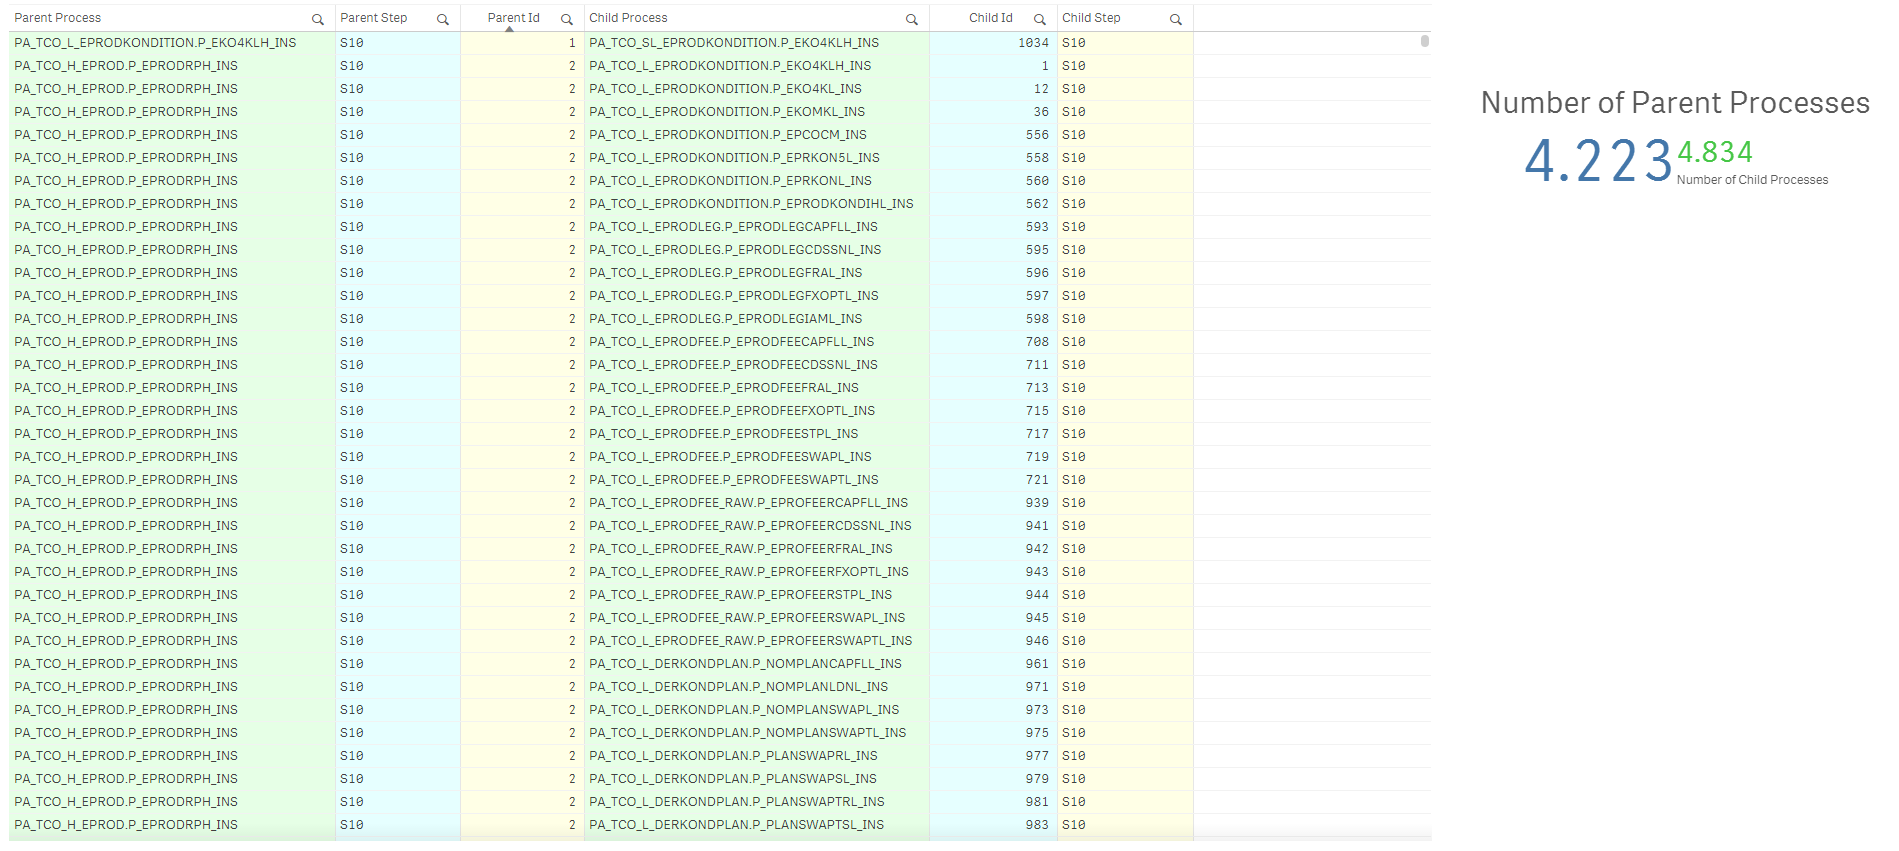
My data set looks like this: Parent Process, Parent Step (S10, S20, S30) and Parent Id Columns, the same repeats for Child. Parent Id and Child Id columns were generated automatically (function AUTONUMBER() in Data Load Editor). As measure I'd like to use the running time of each process.
The problem is that I have many Parent Processes as well as Child and they should be linked with each other regarding the steps made and, that's why I consider DAG visualization. Also I have another table in the App with the detailed information about each process and ideally each process of the DAG visualization should be linked with it to show all other details immediately.
Finally, I should get my Parent and Child Prosesses linked and visualized, something like this.

irregular.bi blog - Graph Data Visualization in QlikView - A Blog about BI and Data Integration
I have also found such kind of link regarding my question, but I am not confident to understand and consider it clearly for this issue.
Graph visualization in Qlik Sense with Ogma - Linkurious
If anyone has already faced such kind of stuff, I kindly ask you to share your experience or ideas.
My apologies if I have not explained everything properly. I would try to add more details if necessary.
Thank you very much in advance.
Best Regards,
Yuliia