Unlock a world of possibilities! Login now and discover the exclusive benefits awaiting you.
- Qlik Community
- :
- Forums
- :
- Analytics & AI
- :
- Products & Topics
- :
- App Development
- :
- Display top N most frequent records in chart
- Subscribe to RSS Feed
- Mark Topic as New
- Mark Topic as Read
- Float this Topic for Current User
- Bookmark
- Subscribe
- Mute
- Printer Friendly Page
- Mark as New
- Bookmark
- Subscribe
- Mute
- Subscribe to RSS Feed
- Permalink
- Report Inappropriate Content
Display top N most frequent records in chart
Hi all - I'm trying to do something that I assume is a simple calculation that I'm struggling with for some time now.
Goal: display only the records that appear more than 2 times in a dataset.
Example of data:
| TableID | ICD-9 Code | Patient ID | Visit ID |
|---|---|---|---|
| 1 | 250 | 1 | A |
| 2 | 250 | 2 | B |
| 3 | 250 | 3 | C |
| 4 | 19 | 4 | D |
| 5 | 493 | 5 | E |
| 6 | 493 | 6 | F |
| 7 | 150 | 5 | G |
| 9 | 493 | 8 | H |
| 10 | 493 | 8 | I |
I'd like to produce a list of all ICD-9 codes that appear more than 2 (or any #) of times in the data, including both the ICD-9 Code value and the count of how many times this unique code appeared
Example output
| ICD-9 Code | # of times the code was found in data (must be at least 2 times) |
|---|---|
| 250 | 3 |
| 493 | 4 |
I've tried a few versions of this but can't seem to get it right
count( DISTINCT {<DX ={"=count(DX)>100"}>}DX), DX
If(Rank(Count(DISTINCT DX)) >100, Count(DISTINCT DX))
Thanks in advance!
- Mark as New
- Bookmark
- Subscribe
- Mute
- Subscribe to RSS Feed
- Permalink
- Report Inappropriate Content
Try this
Dimension
ICD-9 Code
Expression
Count({<[ICD-9 Code] = {"=Count(DX) >= 2"}>}DX)
- Mark as New
- Bookmark
- Subscribe
- Mute
- Subscribe to RSS Feed
- Permalink
- Report Inappropriate Content
Create a Straight/Pivot Table
Dimension
[ICD-9 Code]
Expression
Count(Distinct{<[ICD-9 Code] = {"=COUNT(Distinct TableID) > 2"}>}TableID)
Or
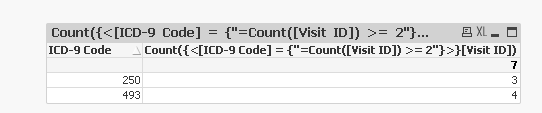
Count({<[ICD-9 Code] = {"=COUNT([ICD-9 Code]) > 2"}>}[ICD-9 Code])
- Mark as New
- Bookmark
- Subscribe
- Mute
- Subscribe to RSS Feed
- Permalink
- Report Inappropriate Content
Here is a sample attached
- Mark as New
- Bookmark
- Subscribe
- Mute
- Subscribe to RSS Feed
- Permalink
- Report Inappropriate Content
Thanks so much - I knew it had to be something simple!