Unlock a world of possibilities! Login now and discover the exclusive benefits awaiting you.
- Qlik Community
- :
- Forums
- :
- Analytics
- :
- Topics
- :
- App Development
- :
- Re: For Qlik Sense. Need a Scatter Plot with 2 dim...
- Subscribe to RSS Feed
- Mark Topic as New
- Mark Topic as Read
- Float this Topic for Current User
- Bookmark
- Subscribe
- Mute
- Printer Friendly Page
- Mark as New
- Bookmark
- Subscribe
- Mute
- Subscribe to RSS Feed
- Permalink
- Report Inappropriate Content
For Qlik Sense. Need a Scatter Plot with 2 dimensions and 2 measures. Showing arrows.
Hello, Collegas!
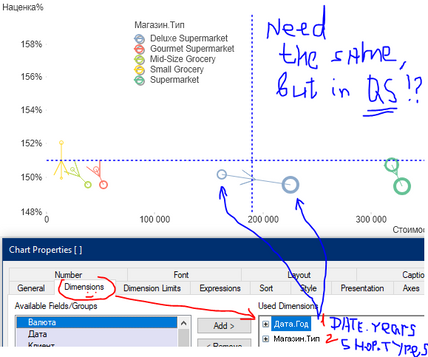
The built-in 'scatter plot' visual in Qlik Sense can't work with 2 dimensions, like it was in QlikView (see below scrshot).
What was the idea to make less powerfull built-in visual in Qlik Sense?
How to produce simply (in par clicks) the same visual in QS?
Of course, there are a lotov new greate opportunities with MAP visual... but was it necessary to kill/reduce previous functionality?
Many thanks for any ideas! 👍👍👍
- Mark as New
- Bookmark
- Subscribe
- Mute
- Subscribe to RSS Feed
- Permalink
- Report Inappropriate Content
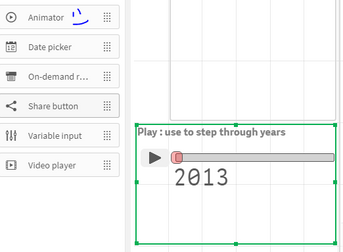
I haven't used that chart in QV. Maybe this animated bubble chart could help.
http://www.codewander.com/qlik-extension-bubble-chart-animated/
- Mark as New
- Bookmark
- Subscribe
- Mute
- Subscribe to RSS Feed
- Permalink
- Report Inappropriate Content
thank you.
Client will not accept any extentions. :((
The same may be done with a built-in instruments of QS. And it is a bit another.)
- Mark as New
- Bookmark
- Subscribe
- Mute
- Subscribe to RSS Feed
- Permalink
- Report Inappropriate Content
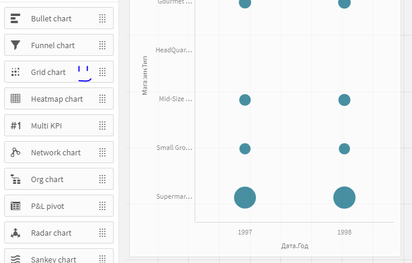
There is a Grid Plot now that can handle multiple dimensions and is more like the QlikView chart, but it doesn't do the lines with arrows between 2 versions of value. If you aren't on a current release that has it there is an extension you can use for your version. https://developer.qlik.com/garden/5c8f639c068f9c001708f281
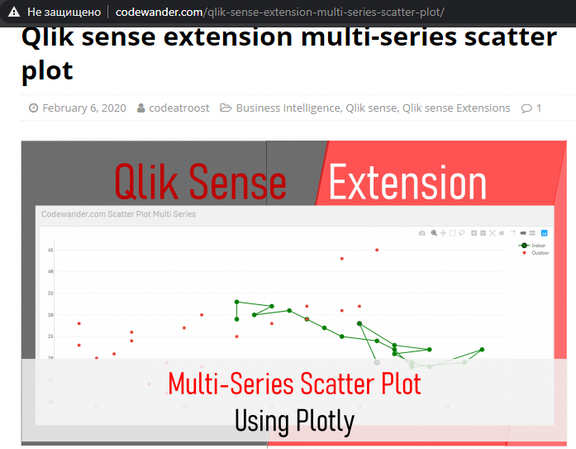
There is an extension that sounds promising based on what I read, but can't attest whether it works well for lines/arrows which it says it can do, but it's only 1 dimension. https://developer.qlik.com/garden/5e3d7176ded02a00183ee035
- Mark as New
- Bookmark
- Subscribe
- Mute
- Subscribe to RSS Feed
- Permalink
- Report Inappropriate Content
thank you.
First option - Grid Plot ... it works already in a built-in QS 'Grid Chart'... it's more about 'grid', not about 'scatter plot' idea)
The Second option is good, sure, needs to be developed a bit for arrows. I saw this extention before... if it will not to be successfull to make required visuality with MAP ... so... time will be spent on works with 'codewander' extention.:(
