Unlock a world of possibilities! Login now and discover the exclusive benefits awaiting you.

- Qlik Community
- :
- Forums
- :
- Analytics & AI
- :
- Products & Topics
- :
- App Development
- :
- Heatmap Pivot Table Qlikview
- Subscribe to RSS Feed
- Mark Topic as New
- Mark Topic as Read
- Float this Topic for Current User
- Bookmark
- Subscribe
- Mute
- Printer Friendly Page

 oscar_olaya
- Mark as New
- Bookmark
- Subscribe
- Mute
- Subscribe to RSS Feed
- Permalink
- Report Inappropriate Content
Heatmap Pivot Table Qlikview
Hello!
Is it possible to create a chart like this in Qlikview? Any Example?
Thanks!
Accepted Solutions

 stevedark
- Mark as New
- Bookmark
- Subscribe
- Mute
- Subscribe to RSS Feed
- Permalink
- Report Inappropriate Content
Hi @oscar_olaya
You want to use the cell background colour expression and the colourmix2 function. This requires three colours which are applied to +1, -1 and 0 respectively. You will need to put your expression in the function and ensure the values fall between 1 and -1. If you already have percentages between 0 and 1 you will need to double them and -1.
colormix2(((sum(Sales) / max(TOTAL Sales))*2)-1, rgb(220,0,0), rgb(0,220,0), rgb(200,90,0))
This image is from Sense, but it works the same in QlikView:
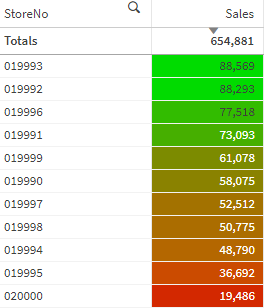
Load script to get dummy data for that is:
SalesData:
LOAD
num(RowNo(), '000000') as StoreNo,
floor(Rand()*100000) as Sales
AUTOGENERATE(20000);
Hope that helps.
Steve
oscar_olaya
- Mark as New
- Bookmark
- Subscribe
- Mute
- Subscribe to RSS Feed
- Permalink
- Report Inappropriate Content
@woutermak Thank you! I complemented it with the gradient
 woutermak
- Mark as New
- Bookmark
- Subscribe
- Mute
- Subscribe to RSS Feed
- Permalink
- Report Inappropriate Content
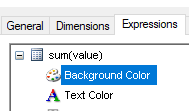
You can use the background color. If you have a range of 0 to 100%, you can use 10 colors to color your cel. Use Argb to use transparency. See in this case value 9. Same as 6 with more transparency.


stevedark
- Mark as New
- Bookmark
- Subscribe
- Mute
- Subscribe to RSS Feed
- Permalink
- Report Inappropriate Content
Hi @oscar_olaya
You want to use the cell background colour expression and the colourmix2 function. This requires three colours which are applied to +1, -1 and 0 respectively. You will need to put your expression in the function and ensure the values fall between 1 and -1. If you already have percentages between 0 and 1 you will need to double them and -1.
colormix2(((sum(Sales) / max(TOTAL Sales))*2)-1, rgb(220,0,0), rgb(0,220,0), rgb(200,90,0))
This image is from Sense, but it works the same in QlikView:
Load script to get dummy data for that is:
SalesData:
LOAD
num(RowNo(), '000000') as StoreNo,
floor(Rand()*100000) as Sales
AUTOGENERATE(20000);
Hope that helps.
Steve
oscar_olaya
- Mark as New
- Bookmark
- Subscribe
- Mute
- Subscribe to RSS Feed
- Permalink
- Report Inappropriate Content
@stevedark Excellent! Just right! Thank you!
oscar_olaya
- Mark as New
- Bookmark
- Subscribe
- Mute
- Subscribe to RSS Feed
- Permalink
- Report Inappropriate Content
@woutermak Thank you! I complemented it with the gradient
