Unlock a world of possibilities! Login now and discover the exclusive benefits awaiting you.
- Qlik Community
- :
- Forums
- :
- Analytics & AI
- :
- Products & Topics
- :
- App Development
- :
- Help with RangeSum and above in bar charts
- Subscribe to RSS Feed
- Mark Topic as New
- Mark Topic as Read
- Float this Topic for Current User
- Bookmark
- Subscribe
- Mute
- Printer Friendly Page
- Mark as New
- Bookmark
- Subscribe
- Mute
- Subscribe to RSS Feed
- Permalink
- Report Inappropriate Content
Help with RangeSum and above in bar charts
I been asked to produce a chart that shows a cumulative count of the pieces of equipment we have installed by Month.
I have managed to do this by using the RangeSum , above and aggr functions.
Here is my code
=round(Aggr(
RangeSum(Above( sum({$<
[Instance Summary - Install Date Num]={"<=$(vtoday)"}
,[Instance - Date Calendar Year Period]=
,[Instance - Status]-={'Not Installed','Replaced','Uninstalled','Terminated'}
,[Instance - Serial Number Flag]={'Y'}
, [Instance - Install Date Flag]={'Y'}
,[Location / Customer Type]={'Installed At'}
,[Instance - Include Flag]={'Y'}
>} [Instance Summary - Count]), 0, RowNo())), [Instance - Date Calendar Year Period]))
It works great however the chart by default without fiters shows the first install period which is 1999 resulting in displaying 235 columns!!
What they want is to have a cumulative total by back to 1999 but only display the last 12 columns ( ie 12 months)
Current (just showing from 2014)
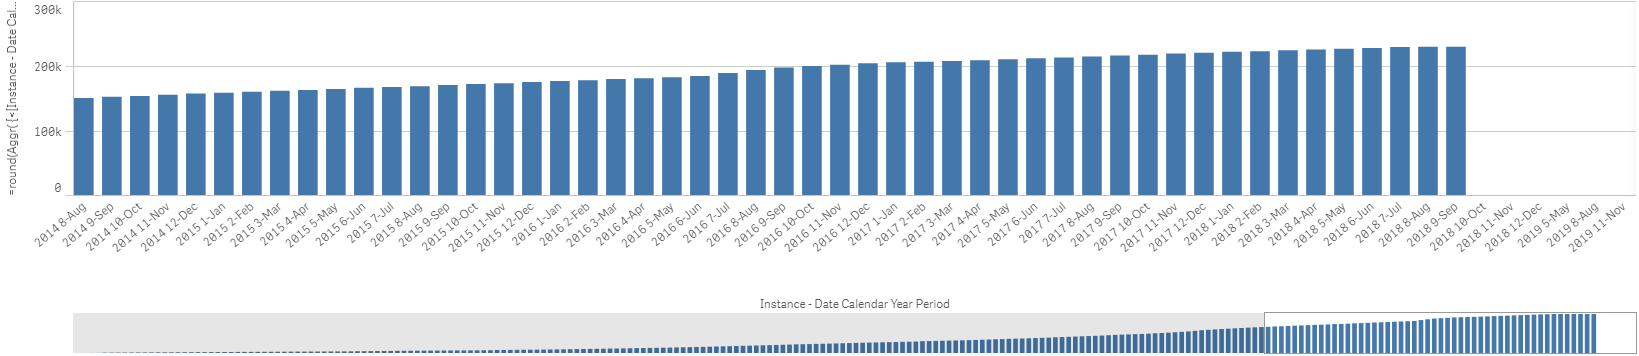
They want to display without filters needing to be selected ( back 12 months from today so 2017 - 10 - Oct)

Any ideas?
- Tags:
- rangesum