Unlock a world of possibilities! Login now and discover the exclusive benefits awaiting you.
- Qlik Community
- :
- Forums
- :
- Analytics
- :
- App Development
- :
- Re: How to change the Styling properties of a Pie ...
- Subscribe to RSS Feed
- Mark Topic as New
- Mark Topic as Read
- Float this Topic for Current User
- Bookmark
- Subscribe
- Mute
- Printer Friendly Page
- Mark as New
- Bookmark
- Subscribe
- Mute
- Subscribe to RSS Feed
- Permalink
- Report Inappropriate Content
How to change the Styling properties of a Pie Chart via Theme
Dear Qlikers,
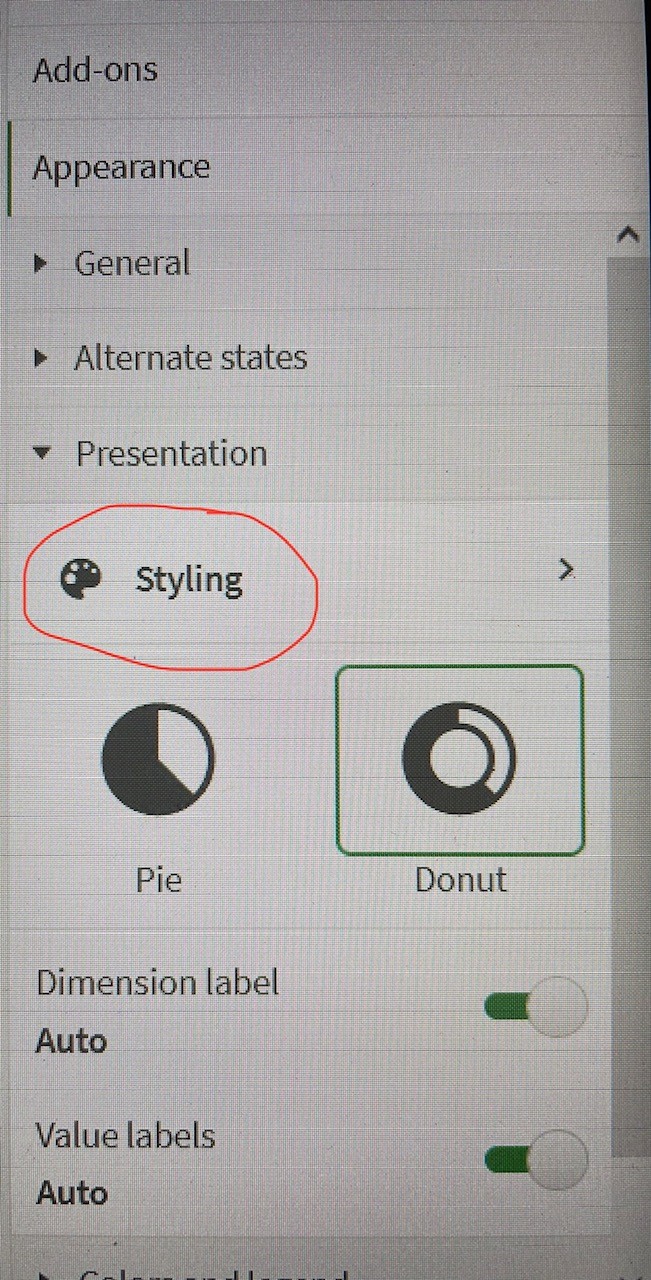
I am creating a new theme and to keep the pie charts consistent in all sheets and applications, I would like to define in my theme the same properties that I have in the Styling menu of the pie charts. Please, see the image for a better understanding of those properties are found in the App Edit Mode.
I checked the QS Help for the Pie Chart regarding those properties, but I didn't find them there.
Could anyone send me an example of how can I implement that the Styling properties using the JSON file for the theme?
If it is not possible to implement it there, can it be done using the respective CSS file for my theme? An example would also be much appreciated.
Thank you very much.
Best regards,
Huberto Pereira Haidemann
- « Previous Replies
-
- 1
- 2
- Next Replies »
Accepted Solutions
- Mark as New
- Bookmark
- Subscribe
- Mute
- Subscribe to RSS Feed
- Permalink
- Report Inappropriate Content
Hi @rbartley,
Thank you very much for your time to help me out with such a question, really appreciated it.
That was also my conclusion but as I don't have enough knowledge about web development, I thought there would be a way to do it. However, as you said, it is not possible.
Thanks once again and best regards,
Huberto
- Mark as New
- Bookmark
- Subscribe
- Mute
- Subscribe to RSS Feed
- Permalink
- Report Inappropriate Content
Have you looked at SenseTheme? If not, take a look at this example https://sensetheme.com/edit/5ee885f1a04760036601e6cc and examine the theme.json and theme.css files to see if it gives you what you want.
- Mark as New
- Bookmark
- Subscribe
- Mute
- Subscribe to RSS Feed
- Permalink
- Report Inappropriate Content
Hi @rbartley,
Thank you for the tip. I had checked that when I started my new theme. However, the configuration provided by Sense Theme in the free version is quite basic.
I checked the Classic Qlik Sense expecting to find something there, but nothing. Any other suggestions?
I also read some of your comments from other posts expecting that you could know how to approach that question.
Best regards,
Huberto Pereira Haidemann
- Mark as New
- Bookmark
- Subscribe
- Mute
- Subscribe to RSS Feed
- Permalink
- Report Inappropriate Content
I am not an expert in this but just checking if you have seen the help documentation, below properties are available for Pie chart as per the documentation over here
"pieChart": { "backgroundColor": "@light", "title": { "main": { "color": "@default", "fontSize": "@font-normal", "fontFamily": "sans-serif" }, "subTitle": { "color": "@default", "fontSize": "@font-normal", "fontFamily": "sans-serif" }, "footer": { "color": "@default", "fontSize": "@font-normal", "fontFamily": "sans-serif", "backgroundColor": "@light" } }, "axis": { "title": { "color": "@default", "fontSize": "@font-normal", "fontFamily": "sans-serif" } }, "legend": { "title": { "fontSize": "@font-normal", "fontFamily": "sans-serif", "color": "@default" }, "label": { "fontSize": "@font-normal", "fontFamily": "sans-serif", "color": "@default" } }, "label": { "name": { "color": "@default", "fontSize": "@font-normal", "fontFamily": "sans-serif" }, "value": { "color": "@default", "fontSize": "@font-normal", "fontFamily": "sans-serif" } } }
- Mark as New
- Bookmark
- Subscribe
- Mute
- Subscribe to RSS Feed
- Permalink
- Report Inappropriate Content
Hi @Digvijay_Singh,
Thanks for your contribution. I also checked the documentation for the pie chart, but those properties are not mentioned there, unfortunately.
Best regards,
Huberto Pereira Haidemann
- Mark as New
- Bookmark
- Subscribe
- Mute
- Subscribe to RSS Feed
- Permalink
- Report Inappropriate Content
Hi Huberto,
Try adding /options/developer to the url when you are in edit mode in an app, then right-click and you should see a Developer option:

Click on this and then properties:

If you scroll to the bottom of the properties window, you will see the properties you were talking about:

If you update one of these properties, you will see that the visualization updates in the app. As such, you could keep a file with the standard properties that you want and paste them in to achieve a common style, e.g. here I have altered the cornerRadius and innerRadius properties:

And here is the result:

I realise that this is not particularly elegant, and I have not looked to see whether all of your requirements are covered, but hopefully it will help.
- Mark as New
- Bookmark
- Subscribe
- Mute
- Subscribe to RSS Feed
- Permalink
- Report Inappropriate Content
Hi @rbartley,
Thank you so much for providing me with such a great information. That’s exactly what I want to manipulate.
What I am not really sure is how to insert it into the theme. The structure looks different and although I have tried, I am not an expert in the area. I also took a look at other default themes from QS, but nothing on that level is used.
Could you give a tip of how to insert those properties into my theme?
Many thanks,
Huberto Pereira Haidemann
- Mark as New
- Bookmark
- Subscribe
- Mute
- Subscribe to RSS Feed
- Permalink
- Report Inappropriate Content
Hi @Huberto ,
I see from the Qlik help pages regarding extended object examples:
"object" : {
  "title": {
    "main": {
      "color" : "@grayscale-40",
      "fontSize" : "20px"
    },
    "subTitle" : {
      "color" : "@grayscale-40",
      "fontSize" : "16px"
    },
    "footer" : {
      "color" : "@grayscale-15",
      "fontSize" : "@text",
      "backgroundColor" : "@grayscale-85"
    }
  },
  "barChart": {
    "title": {
      "main": {
        "color" : "@grayscale-35",
        "fontSize" : "22px"
      },
      "subTitle" : {
        "color" : "@grayscale-35",
        "fontSize" : "18px"
      },
      "footer" : {
        "color" : "@grayscale-35",
        "fontSize" : "14px",
        "backgroundColor" : "@grayscale-80"
      }
    },
    "outOfRange": {
      "color": "@grayscale-40"
    }
  }
}
So, you could try replacing the barChart section with pieChart, e.g.
"pieChart": {
  "axis": {
    "title": {
      "fontSize": "@text"
    }
  },
  "label": {
    "name": {
      "color": "@grayscale-35",
      "fontSize": "@text"
    },
    "value": {
      "color": "@grayscale-35",
      "fontSize": "@text"
    }
  },
  "components": [
    {
      "key": "slices",
      "style": {
        "strokeColor": {
          "index": -1,
          "color": "#FFFFFF"
        },
        "strokeWidth": "none",
        "cornerRadius": 0,
        "innerRadius": 0.55
      }
    }
  ]
}
I just took the defaults that I saw for the pie charts on the help page I mentioned above and added the "components" section that seems to relate to the properties you want to specify.
Of course, you would need to set all of the other theme elements too, so if you don't have a theme yet, just create one using https://sensetheme.com/gallery , download the files and just copy and paste the above text into it.
I haven't had time to try this yet, but this is the general idea.
Let me know if it works.
- Mark as New
- Bookmark
- Subscribe
- Mute
- Subscribe to RSS Feed
- Permalink
- Report Inappropriate Content
Hi @rbartley,
I had tried that as well but had no success. I also checked the QS help for other charts that could have similar properties but again, no luck. That's why I am doubting if QS considers those properties for a new theme.
I also thought the browser inspector (F12 key for Firefox) could tell me anything, but I am not used to that interface and how to look for such properties.
Anyway, I implemented that in my theme and it didn't work. I also added some horrible colors to the pie chart to make sure that at least those were having some effect on the pie charts. If you want to give it a try, the json file is attached. Maybe you find something that is beyond my knowledge.
Thanks and regards,
Huberto
- Mark as New
- Bookmark
- Subscribe
- Mute
- Subscribe to RSS Feed
- Permalink
- Report Inappropriate Content
Hi @Huberto,
I'll take a look at the theme.
With regard to the browser inspector/dev tools, I also tried that a while ago, but the issue is that the charts are returned in a canvas element, which you can no longer inspect (this used to be possible, but restrictions in more recent browsers seem to prevent you looking inside a canvas tag), which means we cannot identify any classes used.
- « Previous Replies
-
- 1
- 2
- Next Replies »