Unlock a world of possibilities! Login now and discover the exclusive benefits awaiting you.
- Qlik Community
- :
- Forums
- :
- Analytics
- :
- App Development
- :
- Re: Ignore some selection in expression but want t...
- Subscribe to RSS Feed
- Mark Topic as New
- Mark Topic as Read
- Float this Topic for Current User
- Bookmark
- Subscribe
- Mute
- Printer Friendly Page
- Mark as New
- Bookmark
- Subscribe
- Mute
- Subscribe to RSS Feed
- Permalink
- Report Inappropriate Content
Ignore selection in expression but I need to still that selection should effect dimension
Hi everyone,
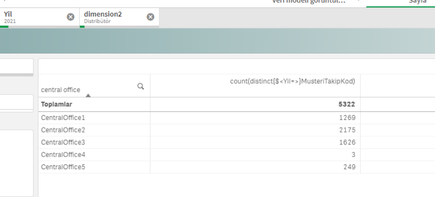
I want to count my customers with ignoring year and month selection, i need whole customers count with aggrgeriton when needed with related dimensions - which year and month is not related- for example centraloffice id is related.
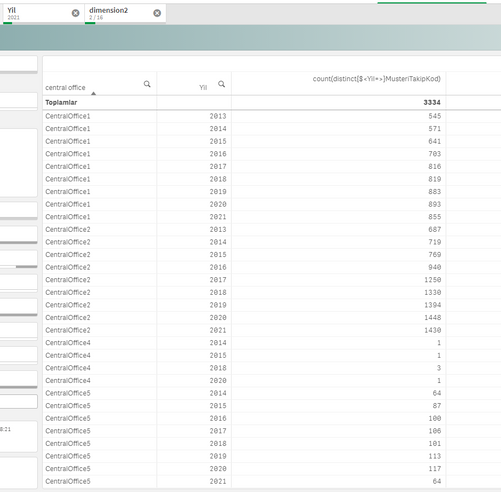
I add 2 ss below, when I try to count({<SalesYear=>}distinct CustomerCode) in table object, if i put year as a dimension then table shows all years which i dont want to see in this object. {1} also doesnt fit for my problem. I tried this:
count(distinct aggr(max({<SalesYear>}CustomerCode),'selecteddimension'))-> it still needs to get {<SalesYear>} in the count func then it shows all salesyears on the raws
I tried P function and it didnt solve my problem either.
And also I tried to give my exppresion into set analysis, which is like count({<CustomerCode= {"=count({<SalesYear>}distinct CustomerCode)>0"}>} distinct CustomerCode), it still affecting by year selections..
What i need is, count all customers by centraloffice with ignoring year selection but I dont need to see whole years on the table when I select just one year..
If you have any idea i ll be gratefull, thanks for now
this ss is calculating true for centrol office on dimension
when I add Year as a dimension, calculation doesn't work, IF i pick 2021 in year, I should just see the table as above with year column with just 2021.
- Subscribe by Topic:
-
Aggr Count
-
Aggr or Set Analysis
-
expression syntax
-
Selection issue
- Mark as New
- Bookmark
- Subscribe
- Mute
- Subscribe to RSS Feed
- Permalink
- Report Inappropriate Content
hi,
pl, provide your expected result from two example table.
ksrini
- Mark as New
- Bookmark
- Subscribe
- Mute
- Subscribe to RSS Feed
- Permalink
- Report Inappropriate Content
I add more detail to main question
- Mark as New
- Bookmark
- Subscribe
- Mute
- Subscribe to RSS Feed
- Permalink
- Report Inappropriate Content
hi,
sry,
please explain how you get this result from your table:
Input Table1:
Input Table2:
Note:
try this link
ksrini


