Unlock a world of possibilities! Login now and discover the exclusive benefits awaiting you.
- Qlik Community
- :
- Forums
- :
- Analytics
- :
- App Development
- :
- Re: IntervalMatch complicated case; 2 common field...
- Subscribe to RSS Feed
- Mark Topic as New
- Mark Topic as Read
- Float this Topic for Current User
- Bookmark
- Subscribe
- Mute
- Printer Friendly Page
- Mark as New
- Bookmark
- Subscribe
- Mute
- Subscribe to RSS Feed
- Permalink
- Report Inappropriate Content
IntervalMatch complicated case; 2 common fields
Hi.
After days of learning and trying I give up.
Case is like this: I have (actually two big fact tables)
Fact table
Statistics table
Map table for location names
Problem is: How to match statistical data to fact table by date and location although statistical table has more location than fact table. And connect it all to location map to analyze facts by time and location and statisitcs by time and location.
I attach xls and qvf files.
sum of Stat_value should be same for each month obiously and has value ot only for months and location existing in fact table but for all months and locations existing in stat table.
Hope I explained it enough to solve it for some pro.
Hope some pro will help me.
Accepted Solutions
- Mark as New
- Bookmark
- Subscribe
- Mute
- Subscribe to RSS Feed
- Permalink
- Report Inappropriate Content
As I tried to explained, the values per month are aggregated in the lower right chart.
If you want to see the original base values, you can load the stats table additionally without creating rows per month.
See attached.
- Mark as New
- Bookmark
- Subscribe
- Mute
- Subscribe to RSS Feed
- Permalink
- Report Inappropriate Content
I am not exactely sure what you are looking for, maybe one of the attached QVF gives you some hint how you can achieve what you want.
- Mark as New
- Bookmark
- Subscribe
- Mute
- Subscribe to RSS Feed
- Permalink
- Report Inappropriate Content
Stefan, thanks. It is much closer than I have ever been. But As you can see statistic value in table are multiplied. Why? How to fix it?
- Mark as New
- Bookmark
- Subscribe
- Mute
- Subscribe to RSS Feed
- Permalink
- Report Inappropriate Content
I assume you are talking about the third attached QVF.
I've created a stat value for each month in the given period, as you can see in the bar chart when selecting a location.
If you aggregate over all year month values (like in the table when not using the year month dimension), you will get the sum of the stat values.
It seems this is not what you want, but I don't know what you expect to see instead, so maybe elaborate on your requirements, please.
- Mark as New
- Bookmark
- Subscribe
- Mute
- Subscribe to RSS Feed
- Permalink
- Report Inappropriate Content
Actually as resault second and third one qvf are pretty much same.
Look at this screen:
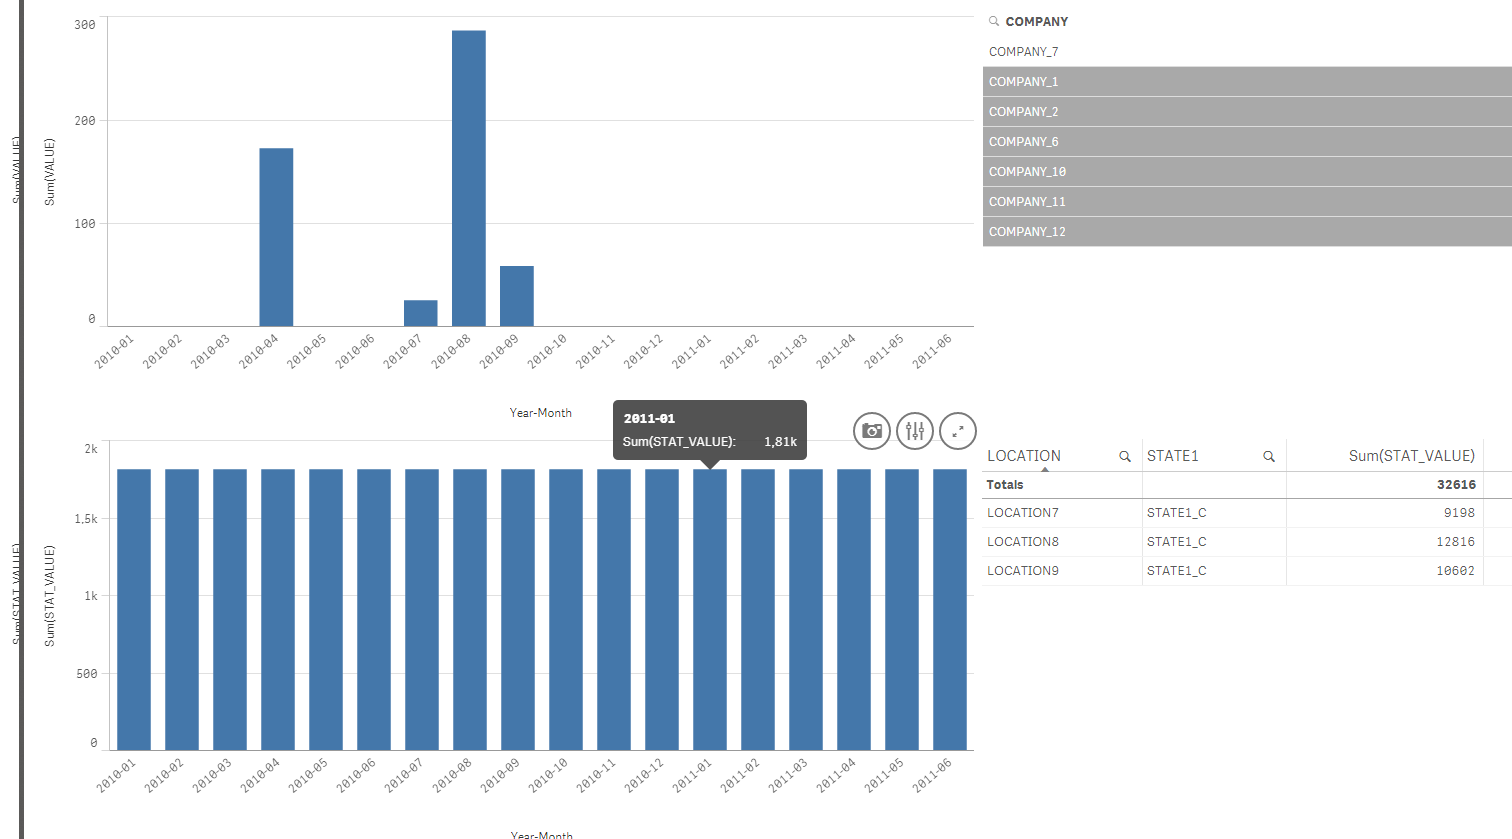
For Selection: STATE1: State1_C
Sum for stat value for every month is ok (1812). Value at top for company is also ok.
But take a look at table on the right for stat value: sum for all locations connected to Location State1_C
(Location7, Location8, Location9) is not truth. According to excel file it should be also 1812
(Location7 : 511 , Location8: 712, Location9: 589).
Why is it wrong? I don't get it.
| DATE FROM | DATE TO | STAT_VALUE | LOCATION |
| 01.01.2010 | 01.06.2011 | 161 | LOCATION1 |
| 01.01.2010 | 01.06.2011 | 606 | LOCATION2 |
| 01.01.2010 | 01.06.2011 | 569 | LOCATION3 |
| 01.01.2010 | 01.06.2011 | 134 | LOCATION4 |
| 01.01.2010 | 01.06.2011 | 729 | LOCATION5 |
| 01.01.2010 | 01.06.2011 | 746 | LOCATION6 |
| 01.01.2010 | 01.06.2011 | 511 | LOCATION7 |
| 01.01.2010 | 01.06.2011 | 712 | LOCATION8 |
| 01.01.2010 | 01.06.2011 | 589 | LOCATION9 |
- Mark as New
- Bookmark
- Subscribe
- Mute
- Subscribe to RSS Feed
- Permalink
- Report Inappropriate Content
As I tried to explained, the values per month are aggregated in the lower right chart.
If you want to see the original base values, you can load the stats table additionally without creating rows per month.
See attached.
- Mark as New
- Bookmark
- Subscribe
- Mute
- Subscribe to RSS Feed
- Permalink
- Report Inappropriate Content
Ok, I get it now. Thank you for your help