Unlock a world of possibilities! Login now and discover the exclusive benefits awaiting you.
Announcements
Talend Cloud AWS EU Scheduled Outage: Starting Tues 26 May 21:00 CEST with expected completion Wed 27 May 01:00 CEST
- Qlik Community
- :
- Forums
- :
- Analytics & AI
- :
- Products & Topics
- :
- App Development
- :
- MTD and YTD bar in a single bar chart
Options
- Subscribe to RSS Feed
- Mark Topic as New
- Mark Topic as Read
- Float this Topic for Current User
- Bookmark
- Subscribe
- Mute
- Printer Friendly Page
Turn on suggestions
Auto-suggest helps you quickly narrow down your search results by suggesting possible matches as you type.
Showing results for
Contributor
2019-07-29
02:29 AM
- Mark as New
- Bookmark
- Subscribe
- Mute
- Subscribe to RSS Feed
- Permalink
- Report Inappropriate Content
MTD and YTD bar in a single bar chart
Hi Everyone,
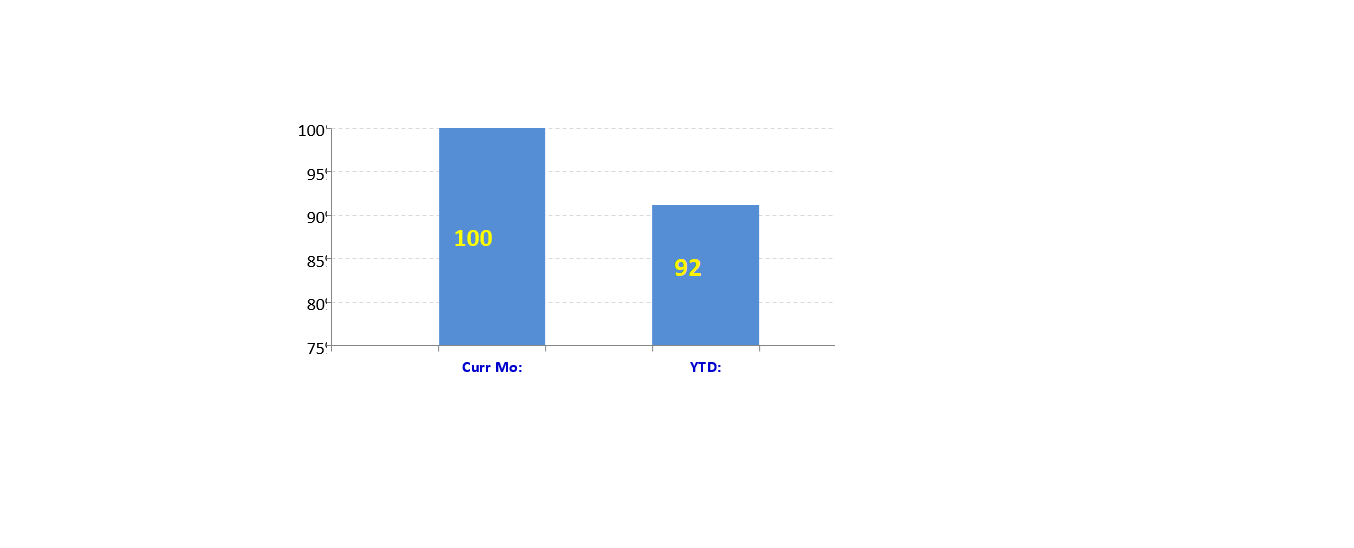
I need to create a chart that shows current month and YTD in dimension, and the corresponding measure value for them.
PFB the data.
| Month | MonthNum | Amount |
| Jan-19 | 1 | 725 |
| Feb-19 | 2 | 549 |
| Mar-19 | 3 | 595 |
| Apr-19 | 4 | 759 |
| May-19 | 5 | 579 |
| Jun-19 | 6 | 595 |
| Jul-19 | 7 | |
| Aug-19 | 8 | |
| Sep-19 | 9 | |
| Oct-19 | 10 | |
| Nov-19 | 11 | |
| Dec-19 | 12 | |
I am able to create the above as two separate charts(Dimesnion & Expression mentioned below).
//Script level variable:
Let vCurrMonth = Num(Month(today())-1);
1st chart:
Dimension:
Month
Expression:
Sum({<MonthNum= {'$(vCurrMonth)'}>}[Amount])
2nd Chart:
Dimension:
Year(Month)
Expression:
Sum({<MonthNum= {"<=$(vCurrMonth)"}>}[Amount])
Please suggest how can I show it in a single chart as shown in attached screenshot.
Thanks,
Reema
- Tags:
- app development
1,263 Views
0 Replies